Written by
Michael J. Firestone, CFA
Written by
Michael J. Firestone, CFA
Published on
January 8, 2026
Category
Market Trends & Commentary

In our view, markets enter 2026 having experienced a period of strong performance, while also facing a meaningful transition. Over the past several years, investors benefited from a rare alignment of resilient economic growth, strong corporate profitability, powerful secular investment themes, and extraordinary fiscal and monetary support. Many of those forces remain in place, but their influence is evolving in ways that matter for both opportunity and risk.
One of the most persistent misconceptions in investing is that markets falter simply because they reach new highs or because central banks begin to ease policy. Historical analysis suggests that such conditions have not always led to negative outcomes. In non-recessionary environments where the Federal Reserve (Fed) has begun cutting rates with equity markets near all-time highs, forward equity returns have more often than not remained positive. This history does not guarantee outcomes, but it challenges the assumption that rate cuts automatically signal economic or market stress.
As we look ahead to 2026, several themes define our outlook:
· Market participation continues to broaden - US large cap equities have benefited from earnings strength and innovation, particularly in artificial intelligence (AI). At the same time, leadership has already begun to rotate. In 2025, while the Magnificent 7 collectively helped power the S&P 500 higher once again, only three of the seven constituents outperformed the broader market. Elsewhere, international markets and precious metals outperformed.
· Returns are likely to be more modest and more uneven - After three consecutive positive years for US equities, history suggests that forward returns tend to moderate and dispersion increases. Earnings growth and dividend income are likely the key factors for continued positive gains opposed to valuation expansion. Returns may be more modest and uneven relative to recent years, particularly if historical patterns repeat.
· The labor market is cooling, not breaking - Hiring has slowed and job openings have normalized, but corporate profitability, productivity gains, and real income growth have supported consumer spending.
· Policy support may be underappreciated - Fiscal stimulus is expected to peak in 2026, while monetary policy is transitioning from restrictive toward neutral. Historically, this combination has reduced the likelihood of abrupt economic slowdowns.
· AI remains a structural growth engine, but risks are rising - Investment remains substantial and largely balance-sheet funded, yet increasing concentration and interdependence heighten the importance of selectivity and diversification.
In this environment, we believe 2026 calls for balance. Broadly diversified, globally invested portfolios may be better positioned to participate in opportunity while managing downside risk.
We believe equity markets enter 2026 with elevated expectations. The S&P 500 has delivered three consecutive years of double-digit gains, an outcome that has been relatively uncommon historically. Since 1950, there have been only a handful of periods in which US equities produced four consecutive positive years, and in those instances average returns tended to be lower and volatility higher than in earlier stages of the cycle. Notably, the last time the S&P 500 posted four consecutive years of double-digit gains was in the late 1990s, though today’s market structure (e.g., profitability, balance-sheet strength, and sector composition) differs meaningfully from that period.
A red flag that we’ve highlighted in past notes is that market concentration has increased meaningfully. The largest companies now represent a historically high share of market capitalization and earnings growth within the S&P 500. This concentration amplified returns during periods of strong leadership, but it has also increased correlations within US equities and reduced the diversification benefit many investors assume exists inside the index.
Despite corporate profitability exceeding expectations, valuations remain elevated. The S&P 500 forward price-to-earnings (P/E) ratio remains well above long-term averages. Importantly, however, valuations did not materially expand in 2025. The market entered last year at an elevated multiple and finished the year at roughly the same level. Most of the returns came from earnings growth, rather than speculative multiple expansion.
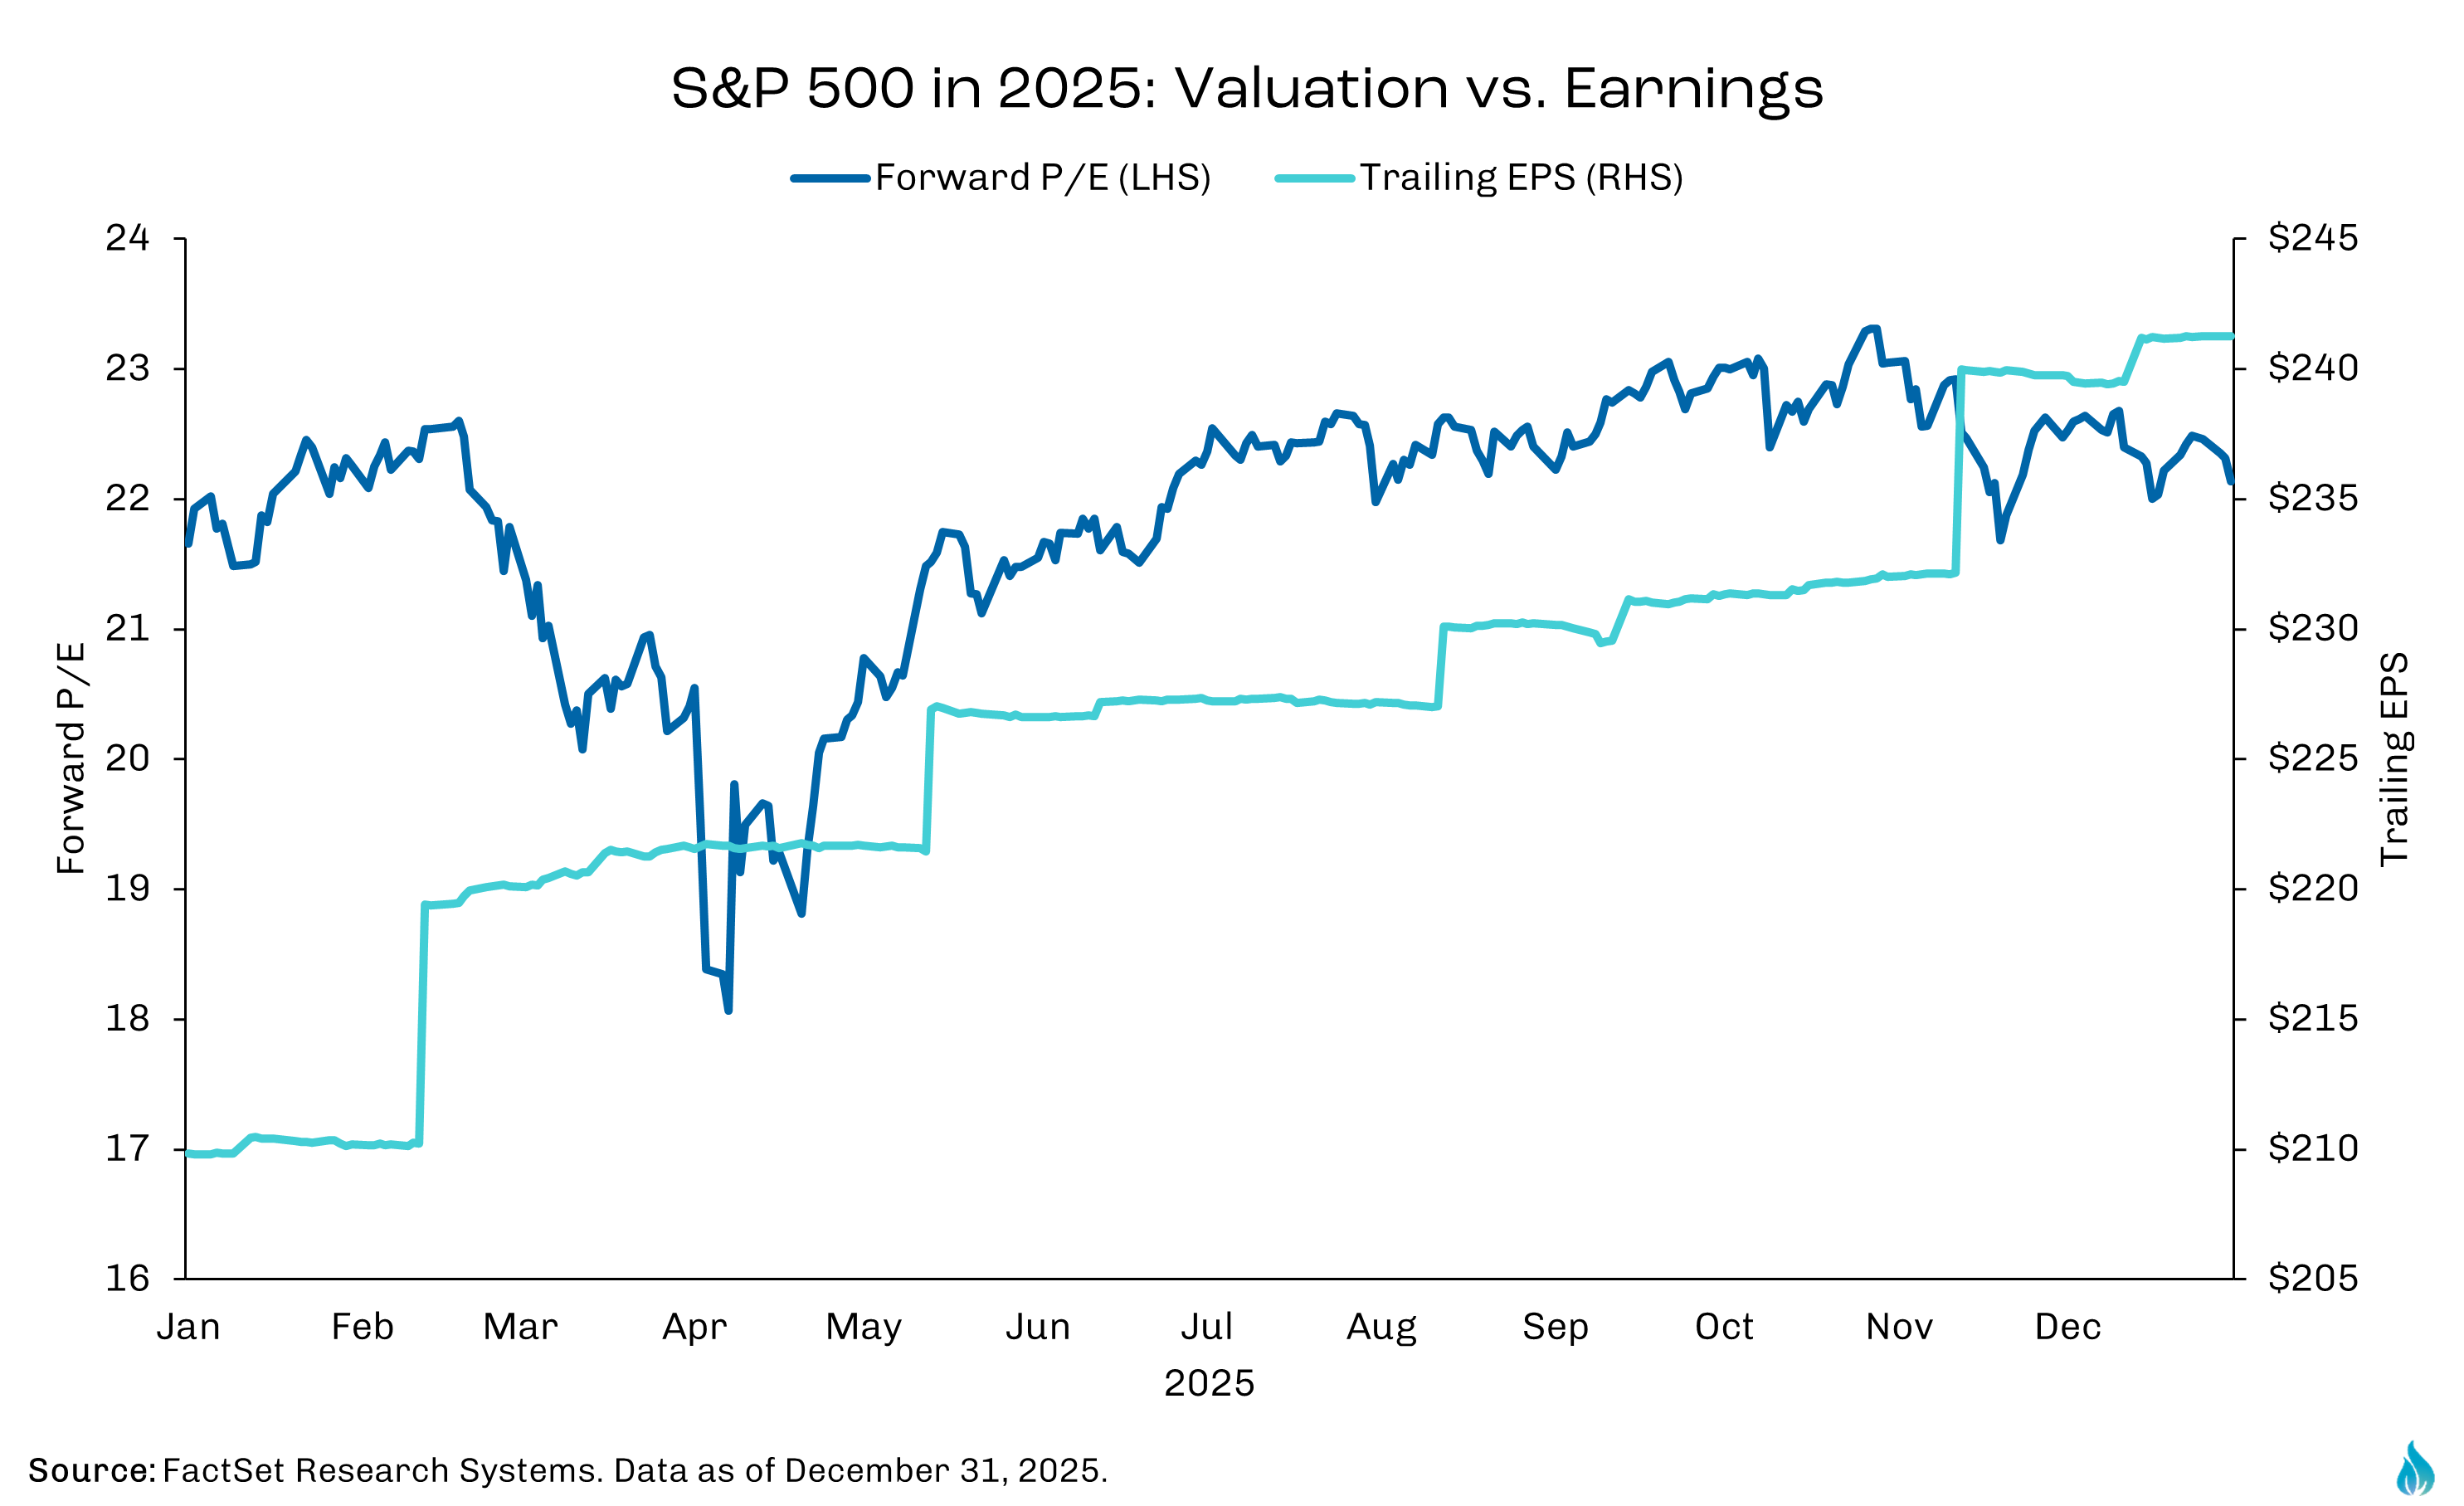
That distinction matters, as valuation-driven rallies tend to be more fragile. Quality-driven returns are healthier, but they also raise the bar for what comes next. FactSet consensus estimates currently reflect approximately 15% earnings growth for the S&P 500 in calendar year 2026, with revenue growth closer to 7% and profit margins expected to remain near historical highs. These are achievable outcomes, but they leave less room for disappointment when starting valuations are elevated. They also mask meaningful dispersion. A small group of large, AI-exposed companies is expected to grow earnings at rates exceeding 20%, while the remainder of the index is projected to grow at a lower, though still solid, double-digit pace.
Historically, environments like this have not required a market downturn to reset expectations. More often, returns have moderated, leadership has rotated, and diversification has mattered more.
The labor market sits at the center of the 2026 outlook because it links income growth, consumer spending, and corporate profitability. Over the past year, labor conditions have clearly cooled from post-pandemic extremes, but labor market cooling has yet to translate to fundamental weakness.
The US unemployment rate moved from roughly 4.0% at the beginning of 2025 to about 4.6% by the end of the year. Hiring decelerated broadly across sectors, with notable weakness in manufacturing, retail/wholesale trade, and transportation, as firms paused new hires amid policy and cost uncertainty. While hiring generally slowed, layoffs picked up, particularly in leisure/hospitality, technology/media, and government. Other jobs data such as continuing claims and average duration of unemployment also indicated cooling but are still far from flashing red. In a prior note we emphasized the characteristics of the current labor market reflect characteristics of a late-cycle expansion, defined more by normalization than contraction. Based on currently available data, this characterization remains reasonable, though conditions may evolve, and this is an area to pay close attention throughout the upcoming year.
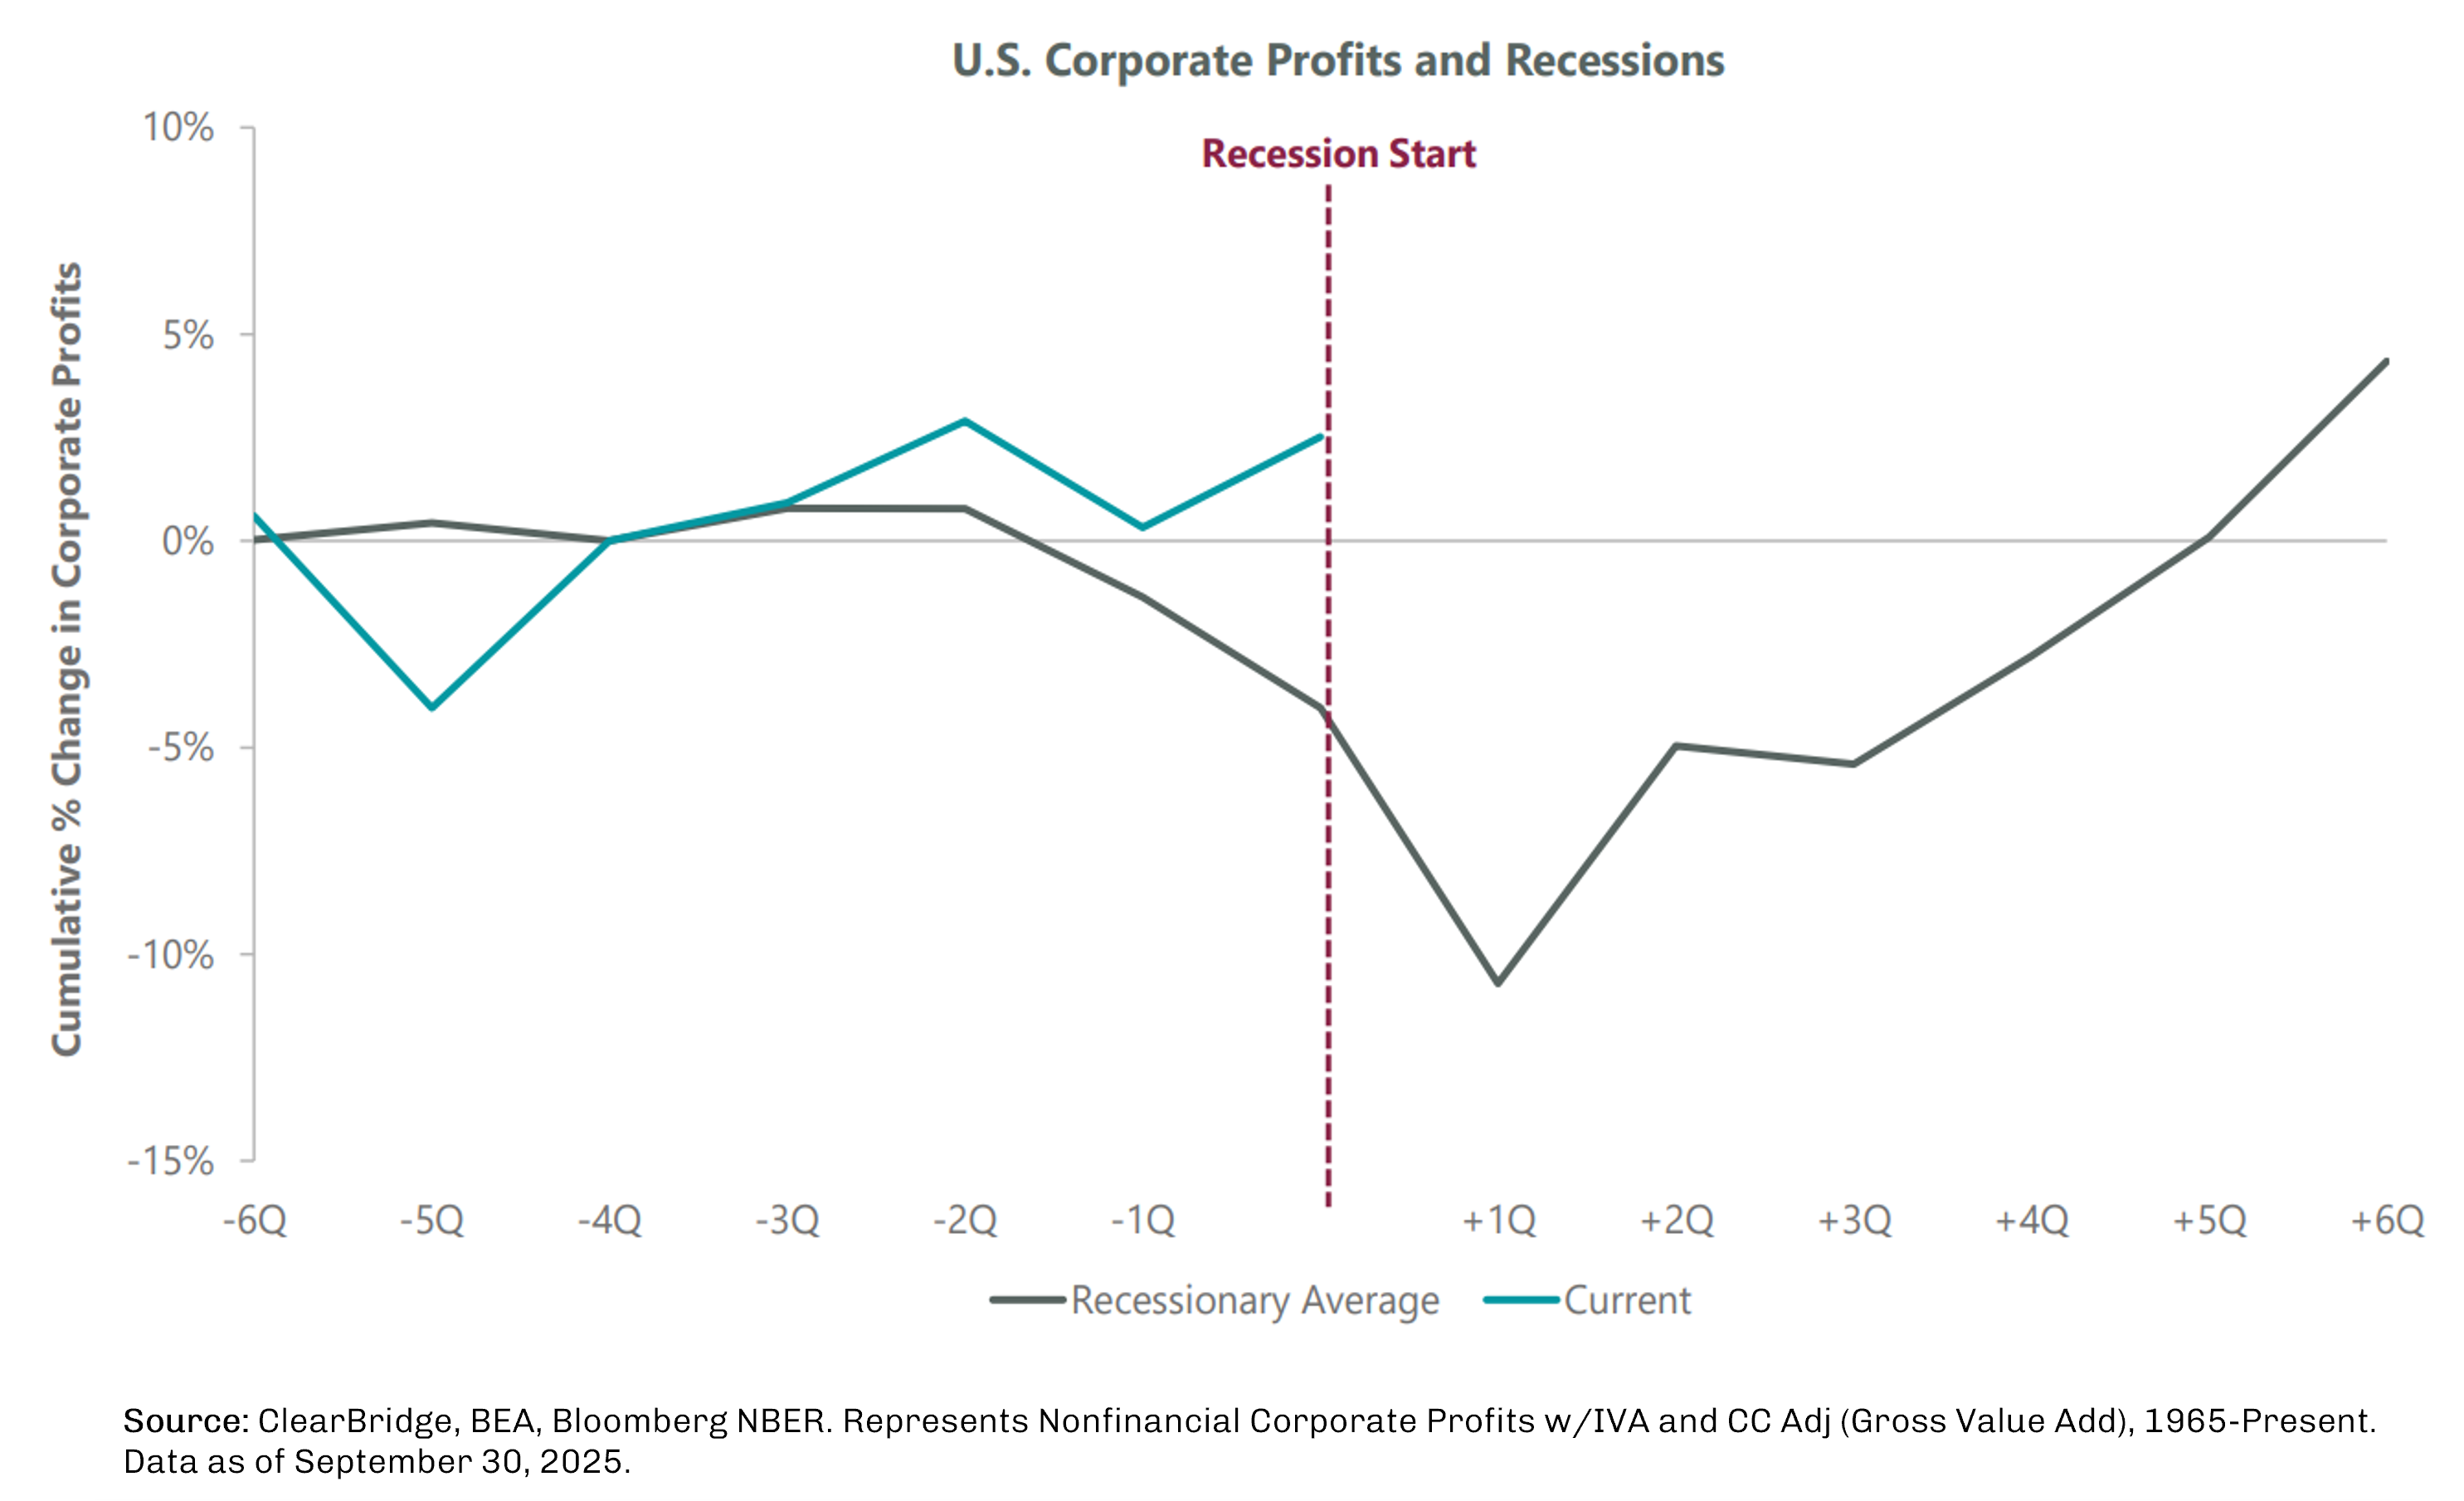
Somewhat uncharacteristic of previous cycles is that labor cooling has occurred alongside resilient corporate profits. Historically, recessions tend to be preceded by a profit squeeze that forces companies to cut labor aggressively. Recent profit trends look materially different, with margins remaining elevated and earnings holding up better than in prior late-cycle periods.
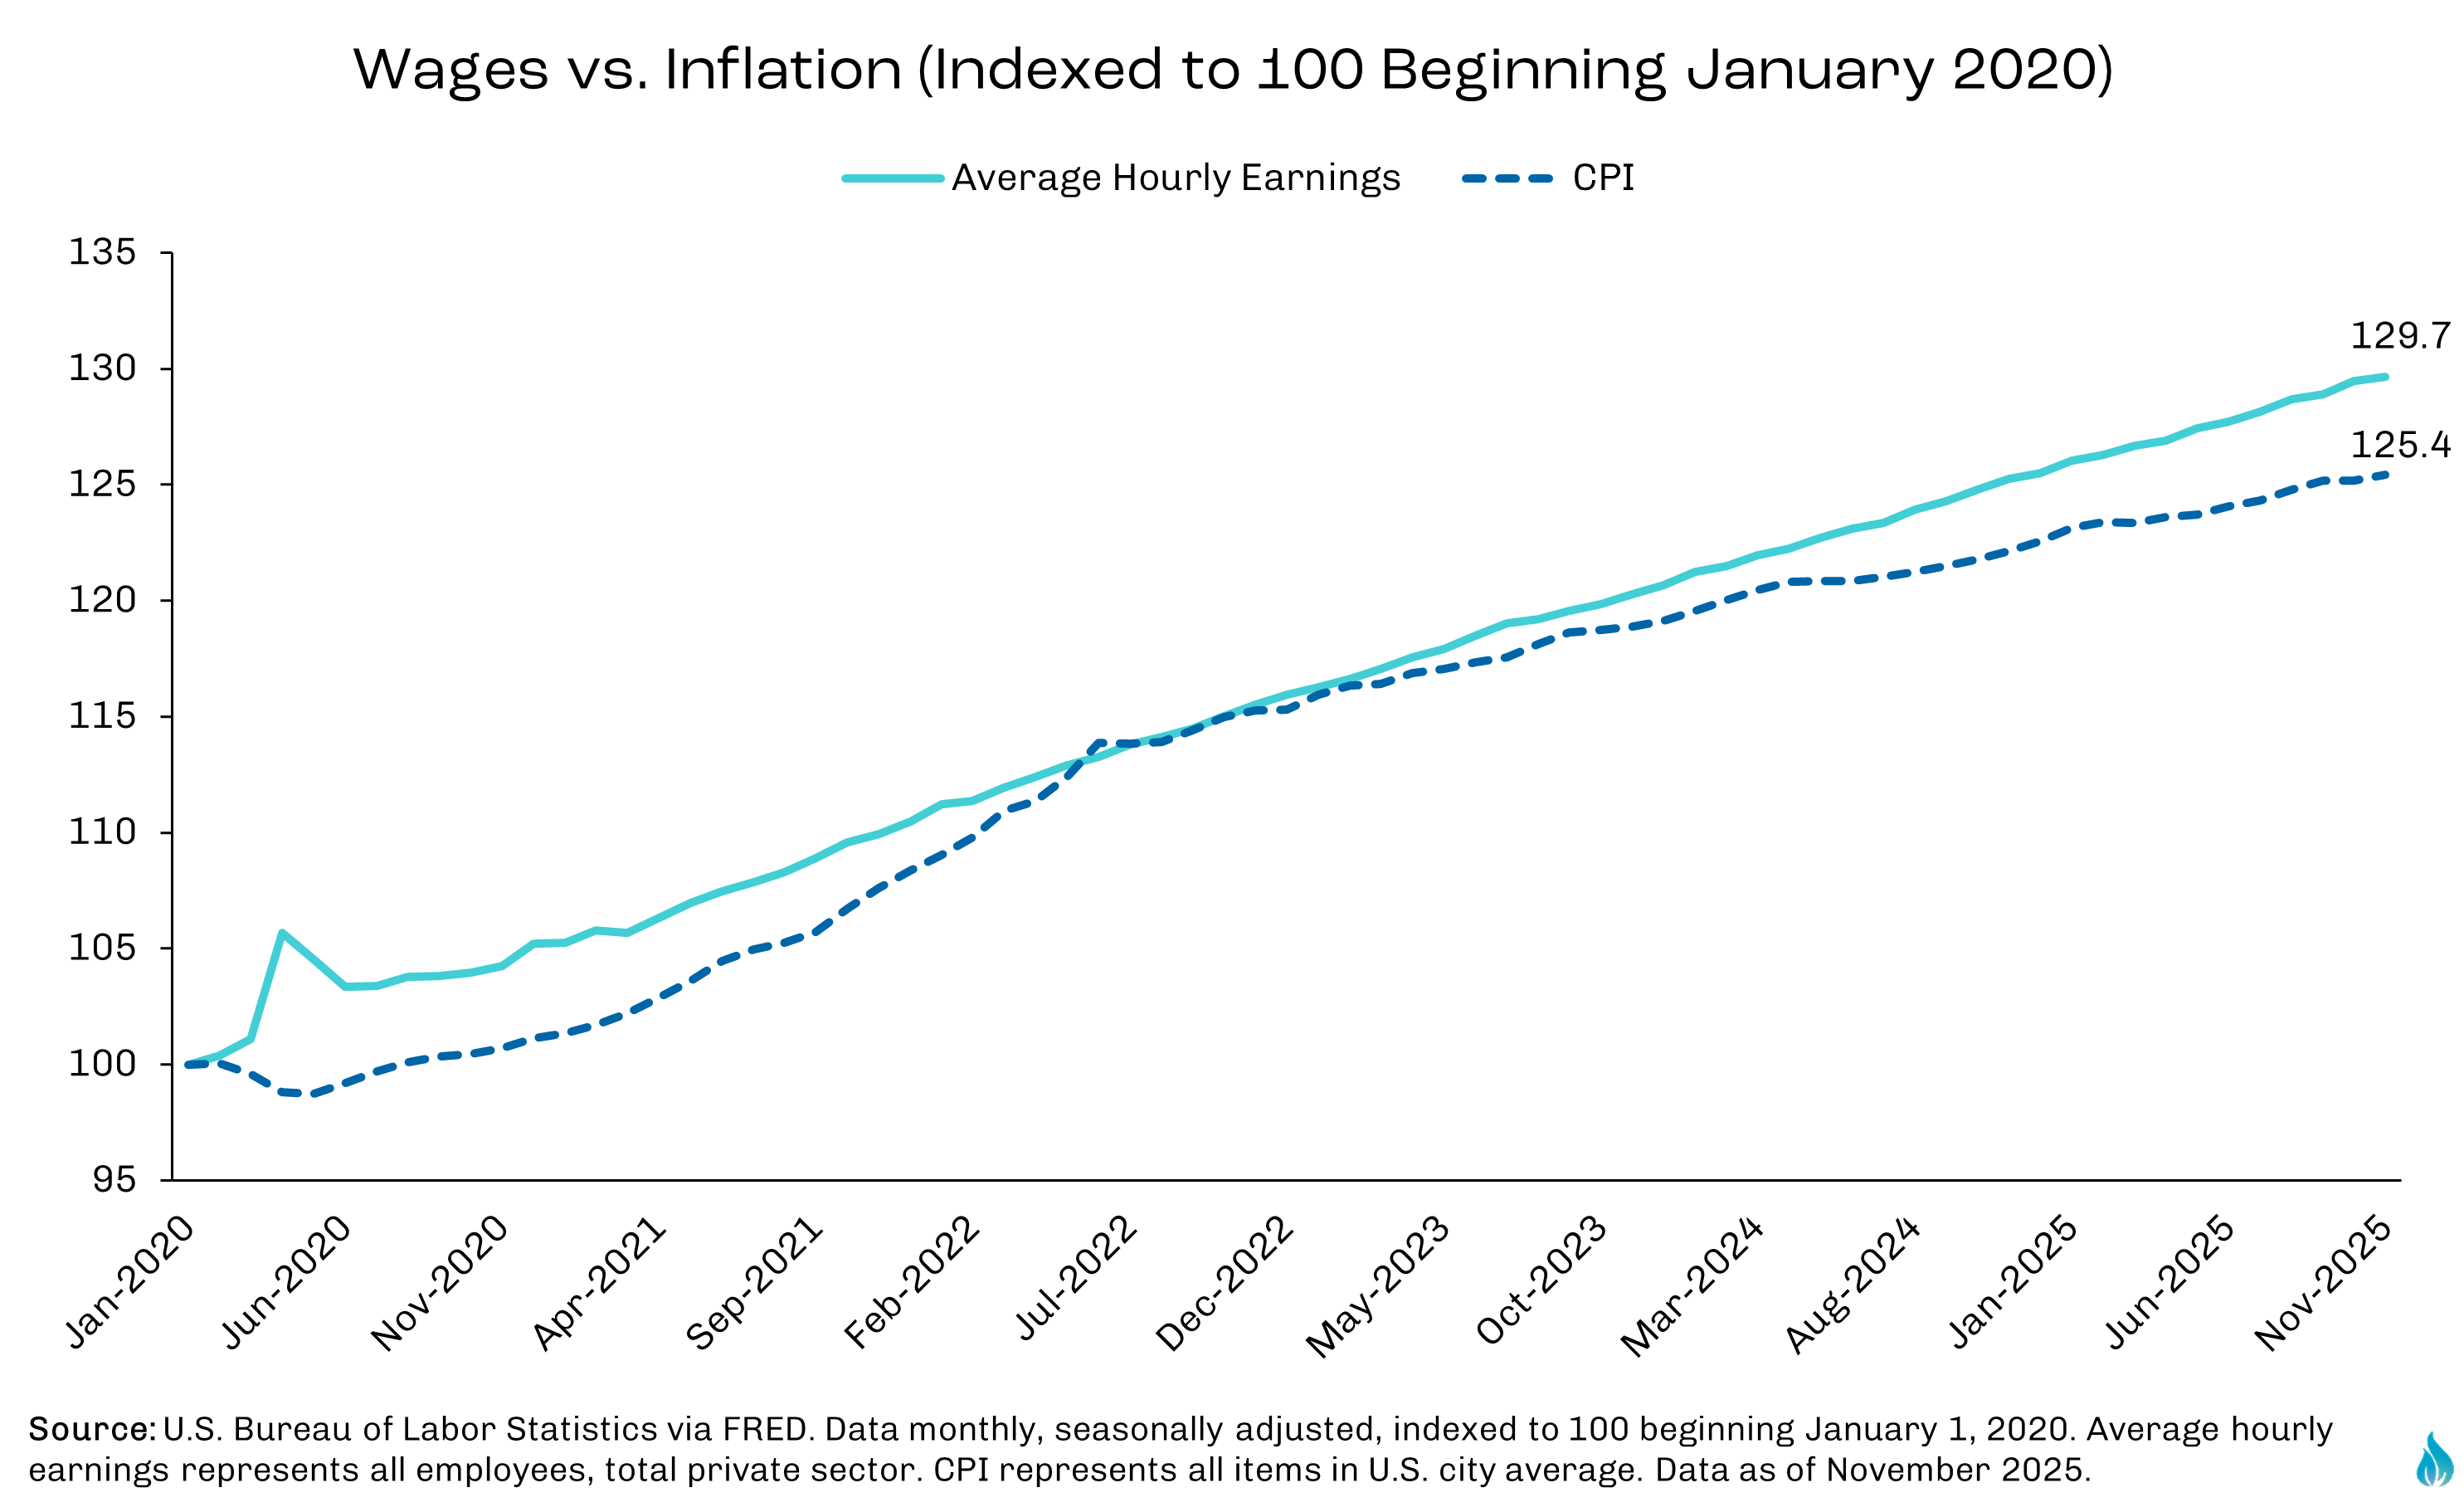
Income dynamics reinforce this picture. Over the past several years, wage growth outpaced inflation, allowing real incomes to rise even as price levels remained elevated. This has been a critical support for consumption as pandemic-era excess savings have largely been depleted.
However, the headline numbers don’t tell the whole story. Higher-income households have benefited disproportionately from stronger income growth and investment portfolio appreciation, while lower- and middle-income households face tighter affordability constraints and greater sensitivity to interest rates. Delinquency rates have risen from historically low levels, though they remain well below those typically associated with recessionary stress.
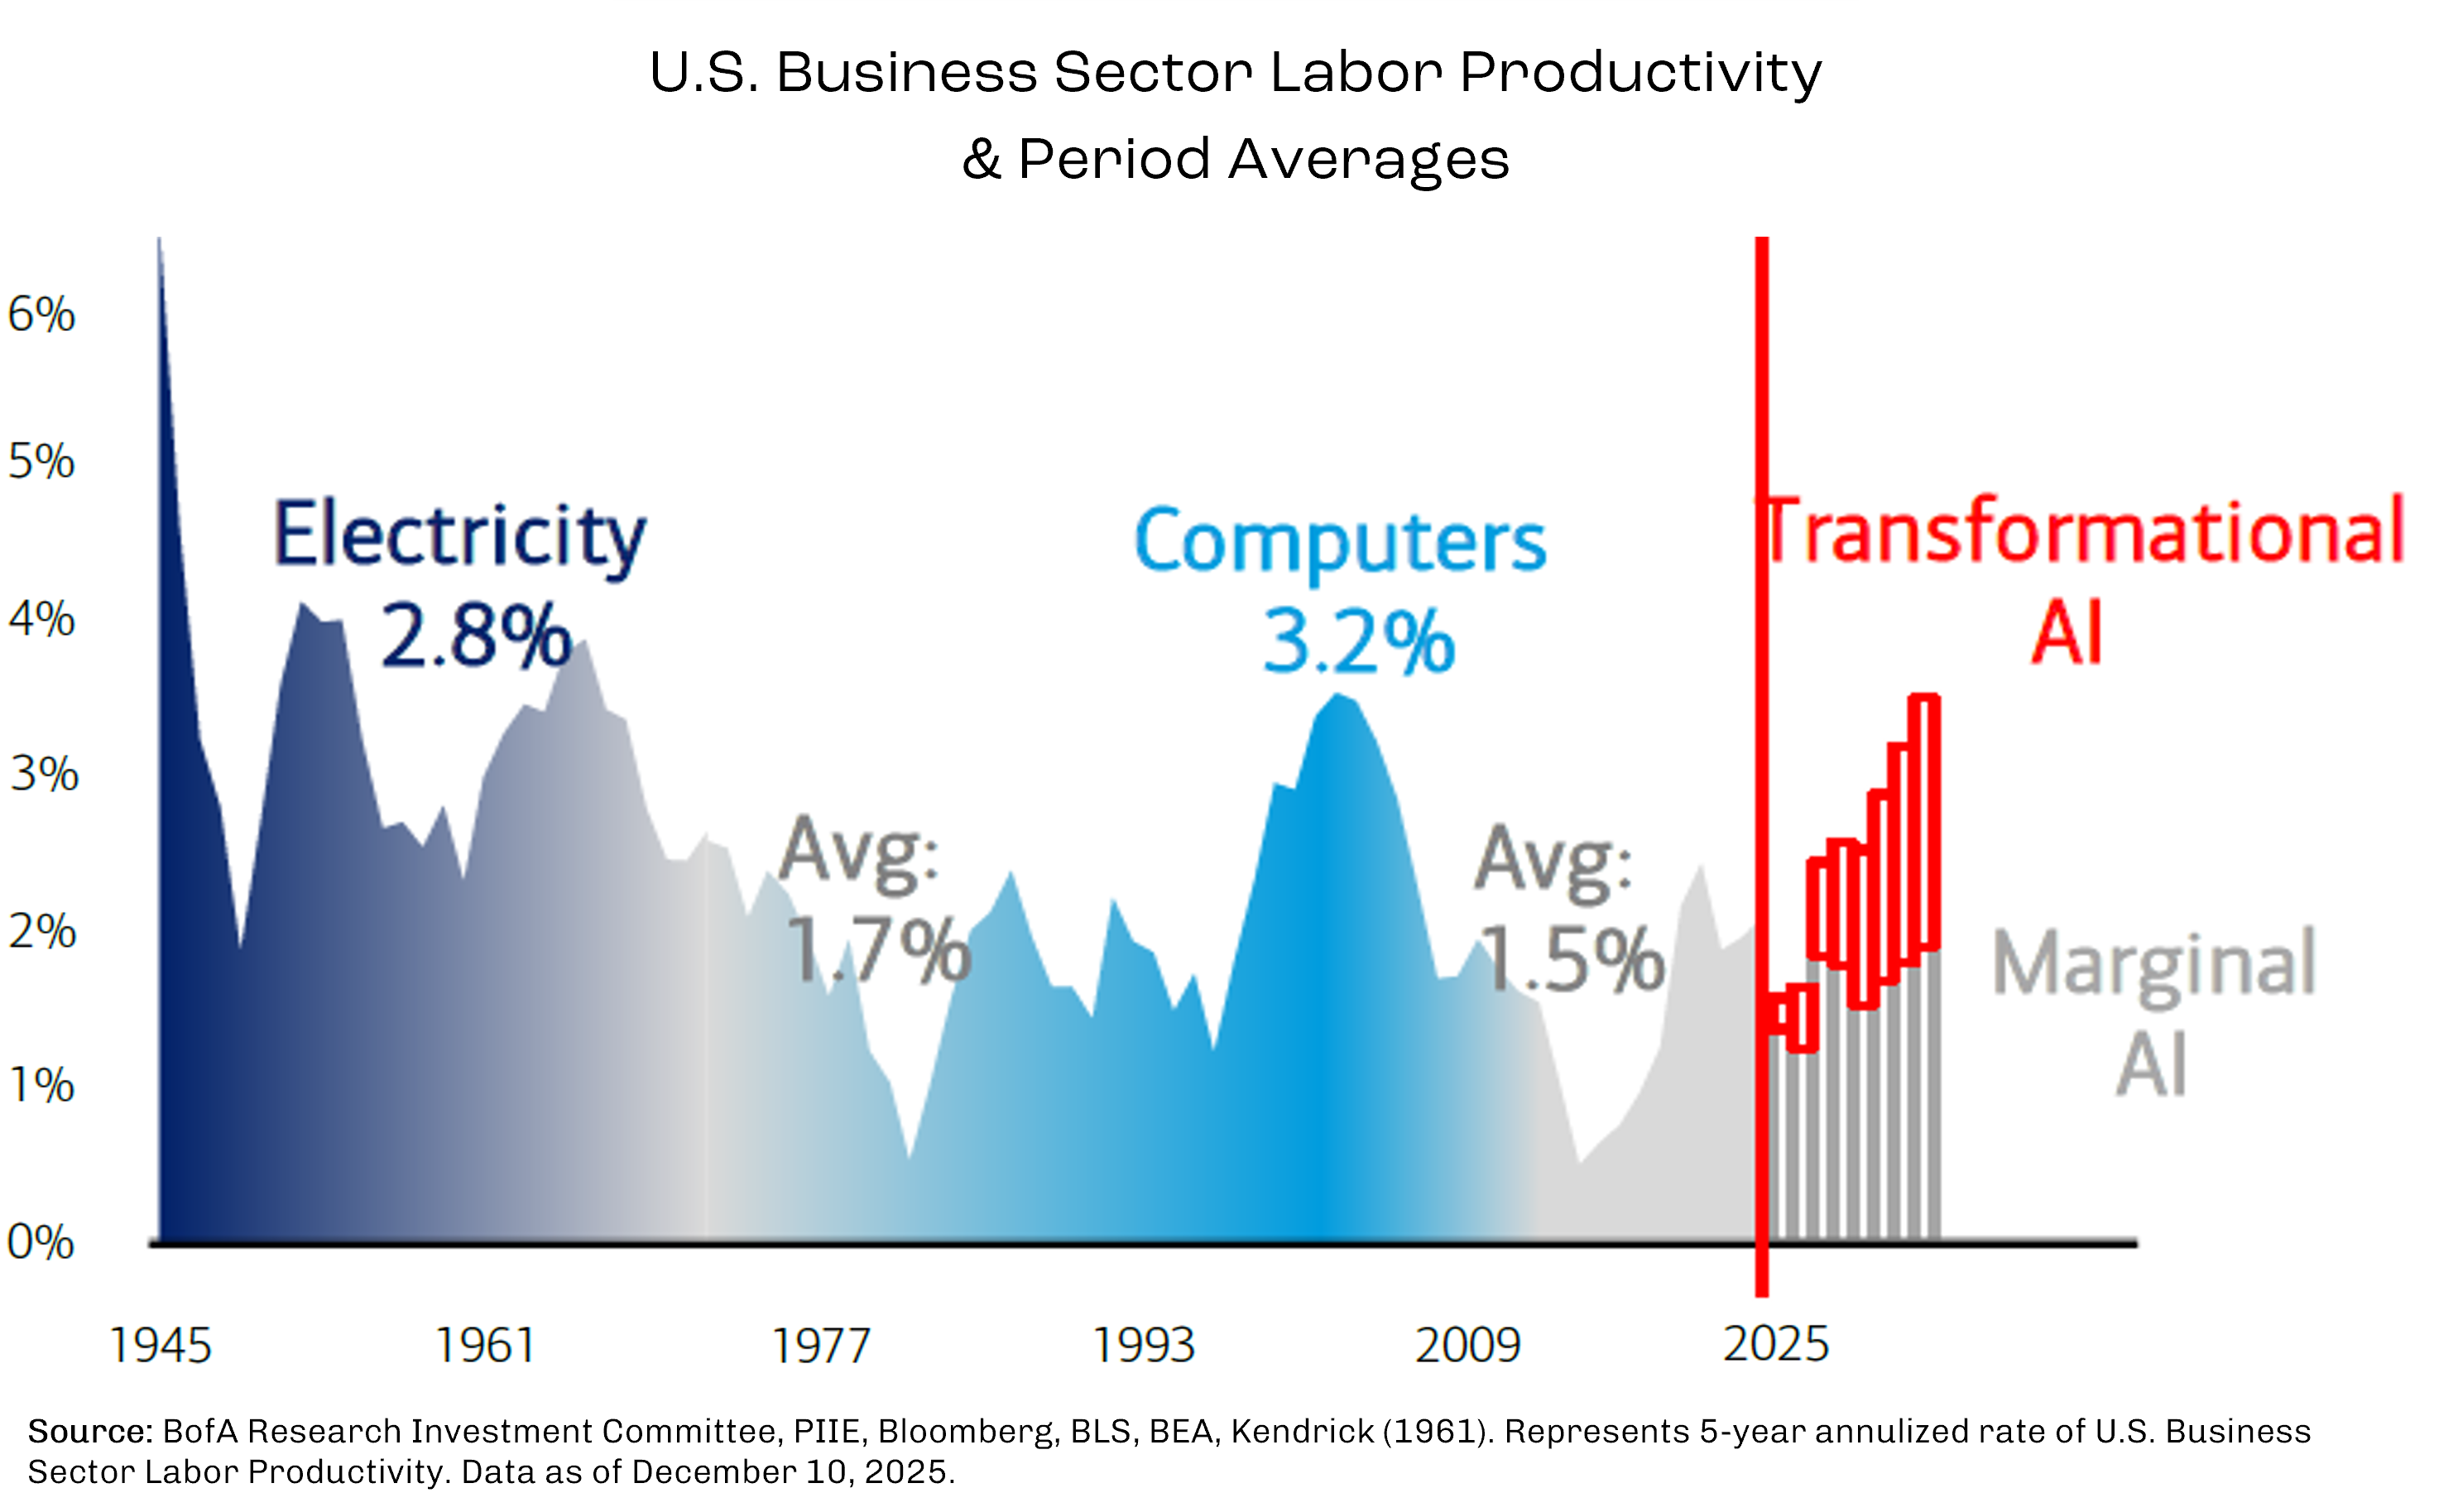
Outside of government stimulus, productivity is a key swing factor. Further productivity gains should allow companies to increase output without expanding payrolls at the same pace, supporting margins and limiting inflationary pressure. If productivity improvements persist, supported by capital-intensive investment and technology adoption, they could help the labor market cool without breaking. If they fade, labor conditions could weaken more quickly. Prior technological innovation periods have led to higher productivity; the hope is that AI will follow suit.
We believe an important factor to monitor in 2026 is the potential interaction between fiscal and monetary policy. On the monetary side, the Fed ended its quantitative tightening (“QT”) program in December. QT refers to the Fed’s action to gradually reduce the size of its balance sheet as the global economy normalized post pandemic. Since its peak in 2022, the Fed’s balance sheet has declined by more than $2 trillion as excess liquidity was withdrawn from the system. While QT acted as a headwind to risk assets, markets historically responded not just to the level of liquidity, but to the change in direction. The transition from tightening to neutral has often coincided with easing financial conditions, tighter credit spreads, and improved market stability. The general belief is that the biggest economic impact of the end of QT may put downward pressure on intermediate and longer-term interest rates, and slight downward pressure on the US Dollar.
More closely tracked and scrutinized is the Fed’s policy rate, also known as the federal funds rate. The Fed’s dot plot shows unusually wide dispersion among policymakers, reflecting uncertainty around the optimal path of interest rates moving forward. The median projection implies rates moving toward the mid-3% range, or 1-2 more rate cuts, by the end of 2026.
In our view, under certain economic scenarios, the Fed could ultimately pursue a more accommodative policy path than current market expectations reflect. This is in part due to the almost certain change in Fed leadership. Fed Chair Jerome Powell’s current term is scheduled to expire in May 2026, and changes in Fed leadership and voting composition over time may influence the policy debate.
In addition, the composition of the Federal Open Market Committee (FOMC) is also set to change meaningfully in 2026, with four regional Fed Bank presidents rotating into voting roles and several outgoing voters who previously expressed more caution on rate cuts rotating off the committee. In addition, the resignation of Governor Adriana Kugler created an early vacancy on the Board of Governors, giving the President the opportunity to appoint a new governor who will participate in rate decisions once confirmed. While policy is determined by majority vote, these changes, combined with new leadership at the Chair level, may influence the range of views represented in policy discussions and may increase the likelihood that the committee’s center of gravity shifts modestly more supportive of rate cuts.
Historically, non-recessionary easing cycles have been supportive for both equities and bonds, while cash tends to lose relative appeal as yields fall. The key takeaway is that if the labor market stabilizes and economic growth advances as expected, asset prices could benefit more than we expect.

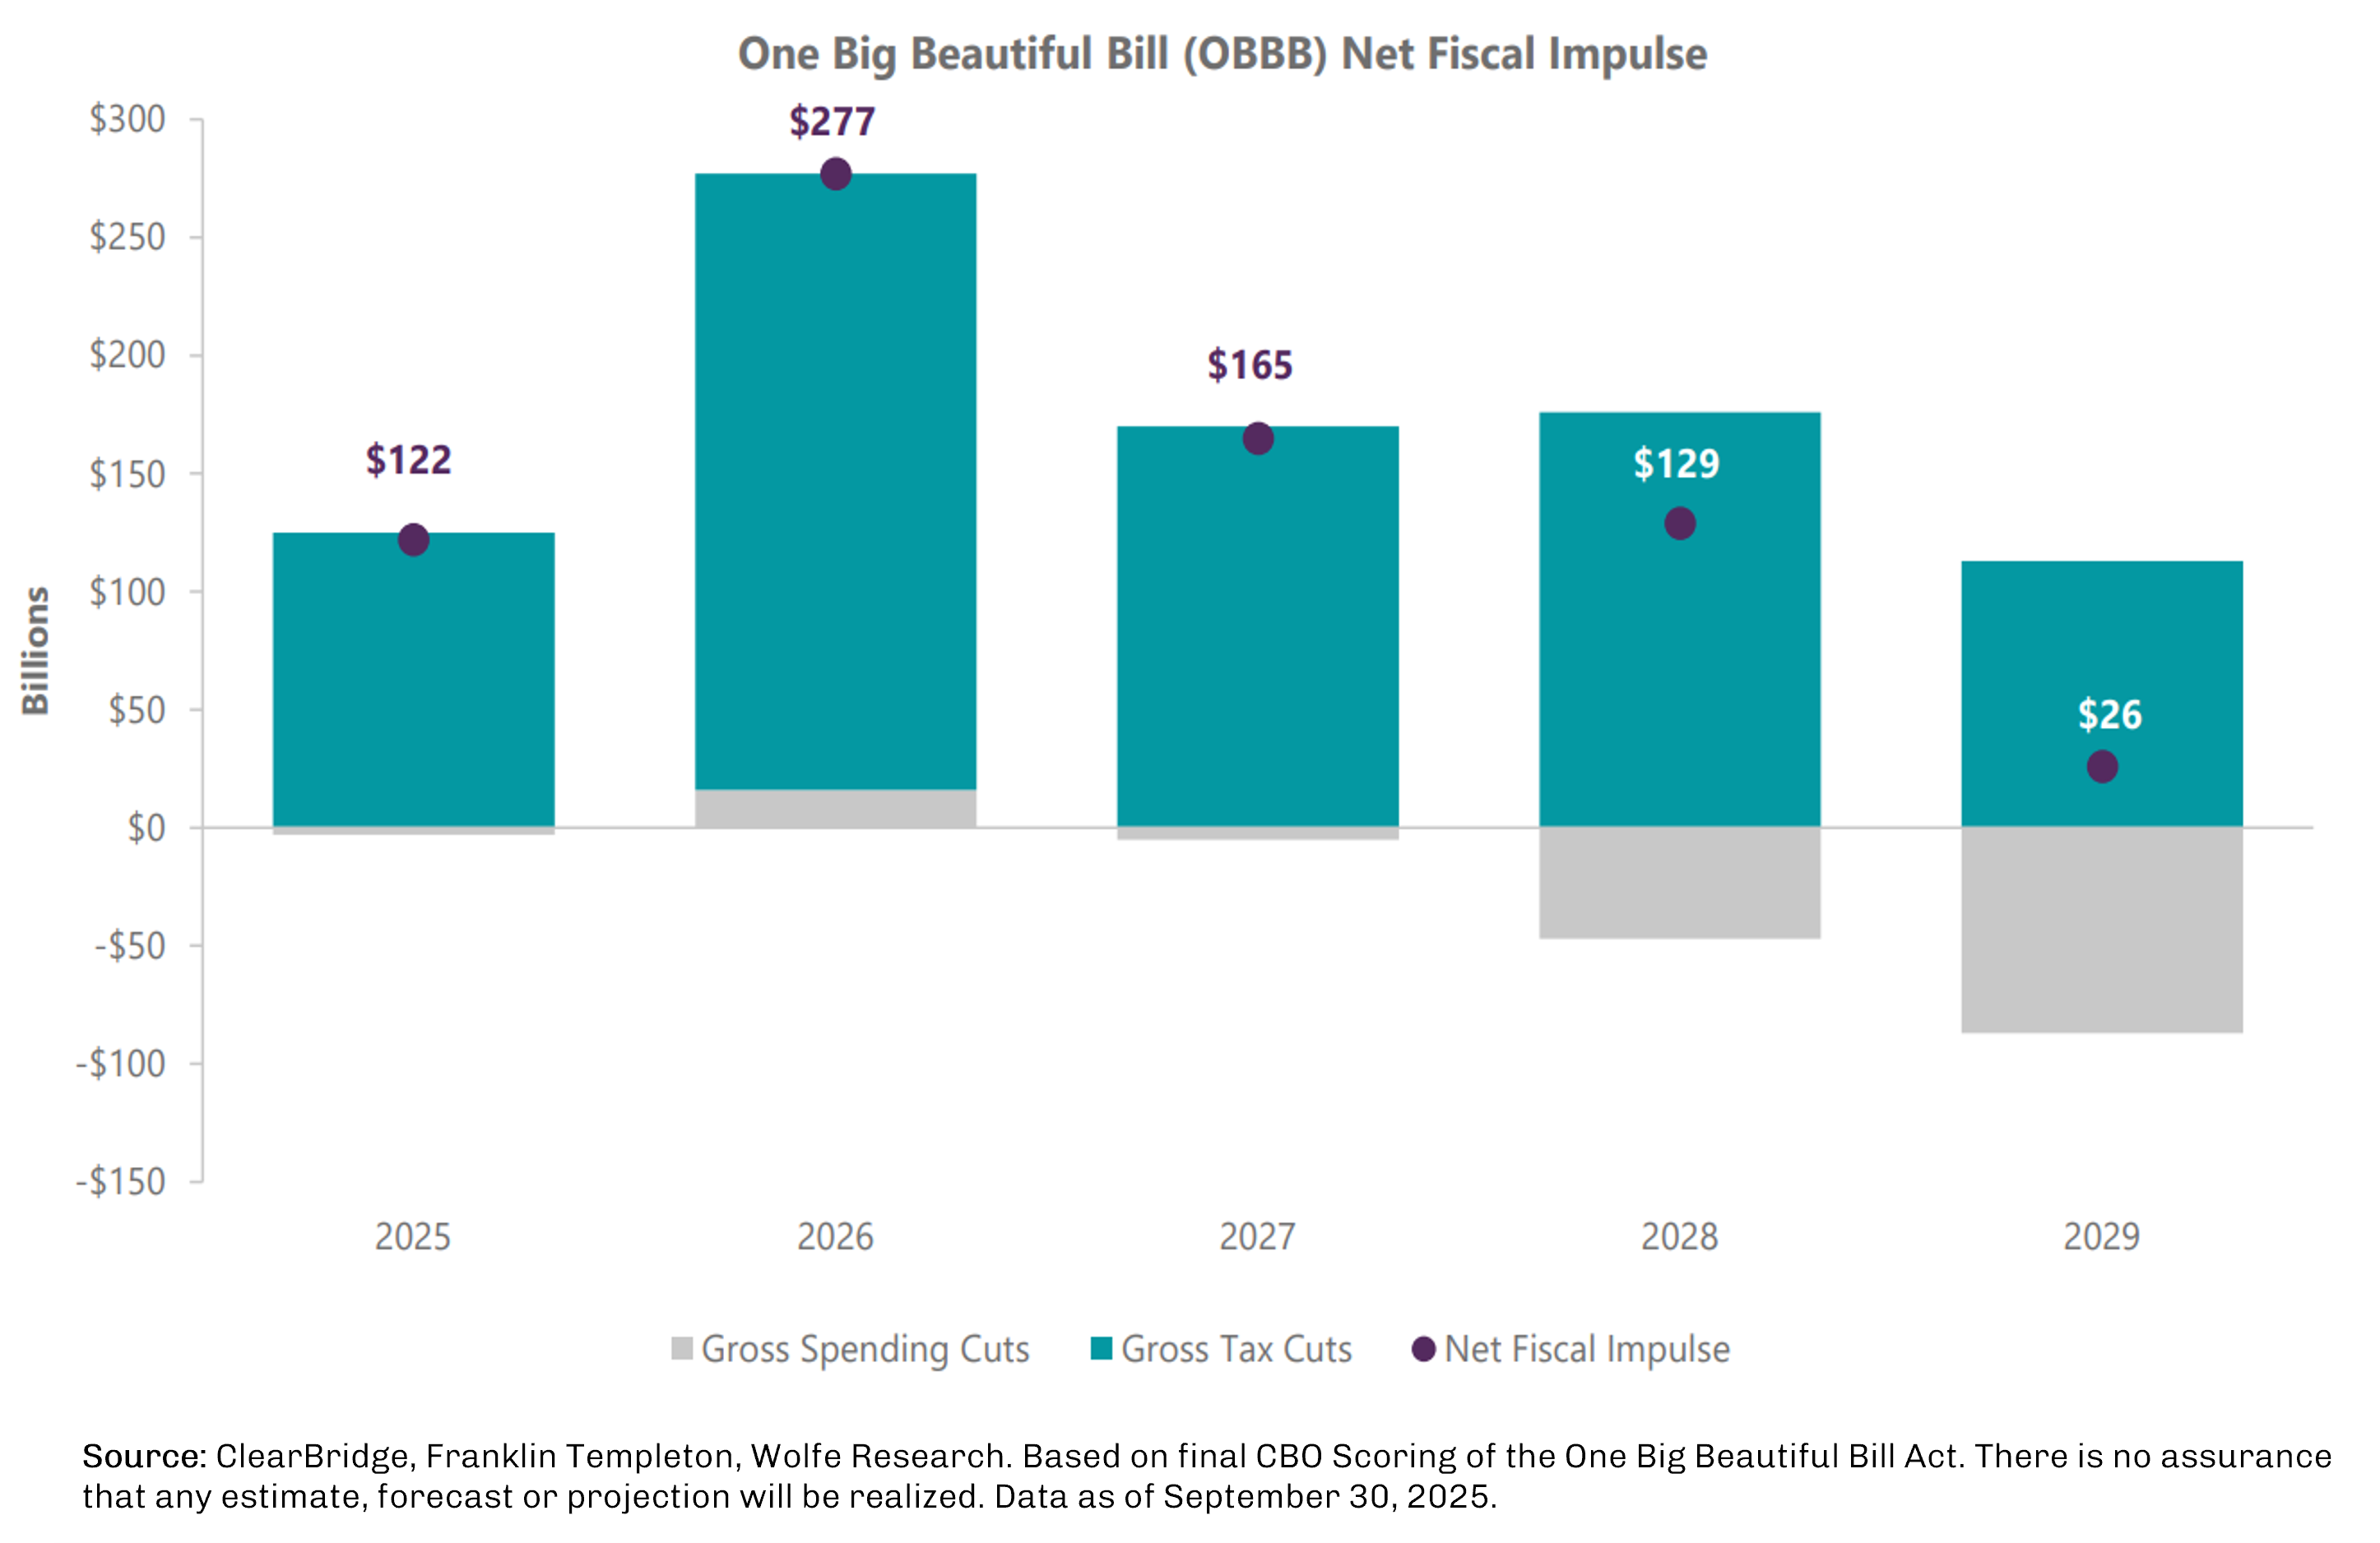
Fiscal policy is also set to play a more meaningful role in supporting growth in 2026, driven in large part by the timing and structure of the One Big Beautiful Bill Act (OBBBA). Based on third-party estimates and analysis, the net fiscal impulse from OBBBA is expected to peak in 2026 at roughly 1% of GDP, before fading in subsequent years. This represents a meaningful boost by historical standards outside of crisis periods and arrives at a time when monetary policy is transitioning from restrictive toward more neutral. Historically, periods in which fiscal and monetary policy move in the same direction have reduced recession risk and provided a more forgiving backdrop for corporate earnings and risk assets.
Beyond the headline impulse, OBBBA includes several features that reinforce near-term economic support. Business investment incentives are structured to pull forward capital spending into 2026, supporting productivity, domestic manufacturing, and capital-intensive industries already benefiting from secular tailwinds such as AI and infrastructure investment. In addition, the legislation is expected to generate larger-than-normal tax refunds for certain households and businesses, providing a temporary but tangible cash-flow boost that tends to be spent more quickly than gradual tax relief. Changes to the SALT deduction, while more targeted, increase after-tax income for higher-income households in high-tax states. Taken together, these elements suggest fiscal policy in 2026 is more stimulative than commonly appreciated, helping to raise the floor under growth even as the labor market cools.
That said, an alternative perspective is that the combined stimulus risk may be an overheating economy rather than a potential recession. With fiscal stimulus peaking in 2026, monetary policy likely becoming less restrictive, and capital spending already elevated across both public and private markets, there is a scenario in which demand proves more resilient than expected. In this environment, inflation could re-emerge as a concern, particularly if productivity gains fall short, labor market slack remains limited, or policy easing occurs before price pressures are fully contained. Under those conditions, inflation may stabilize above the Fed’s target rather than continuing its gradual decline.
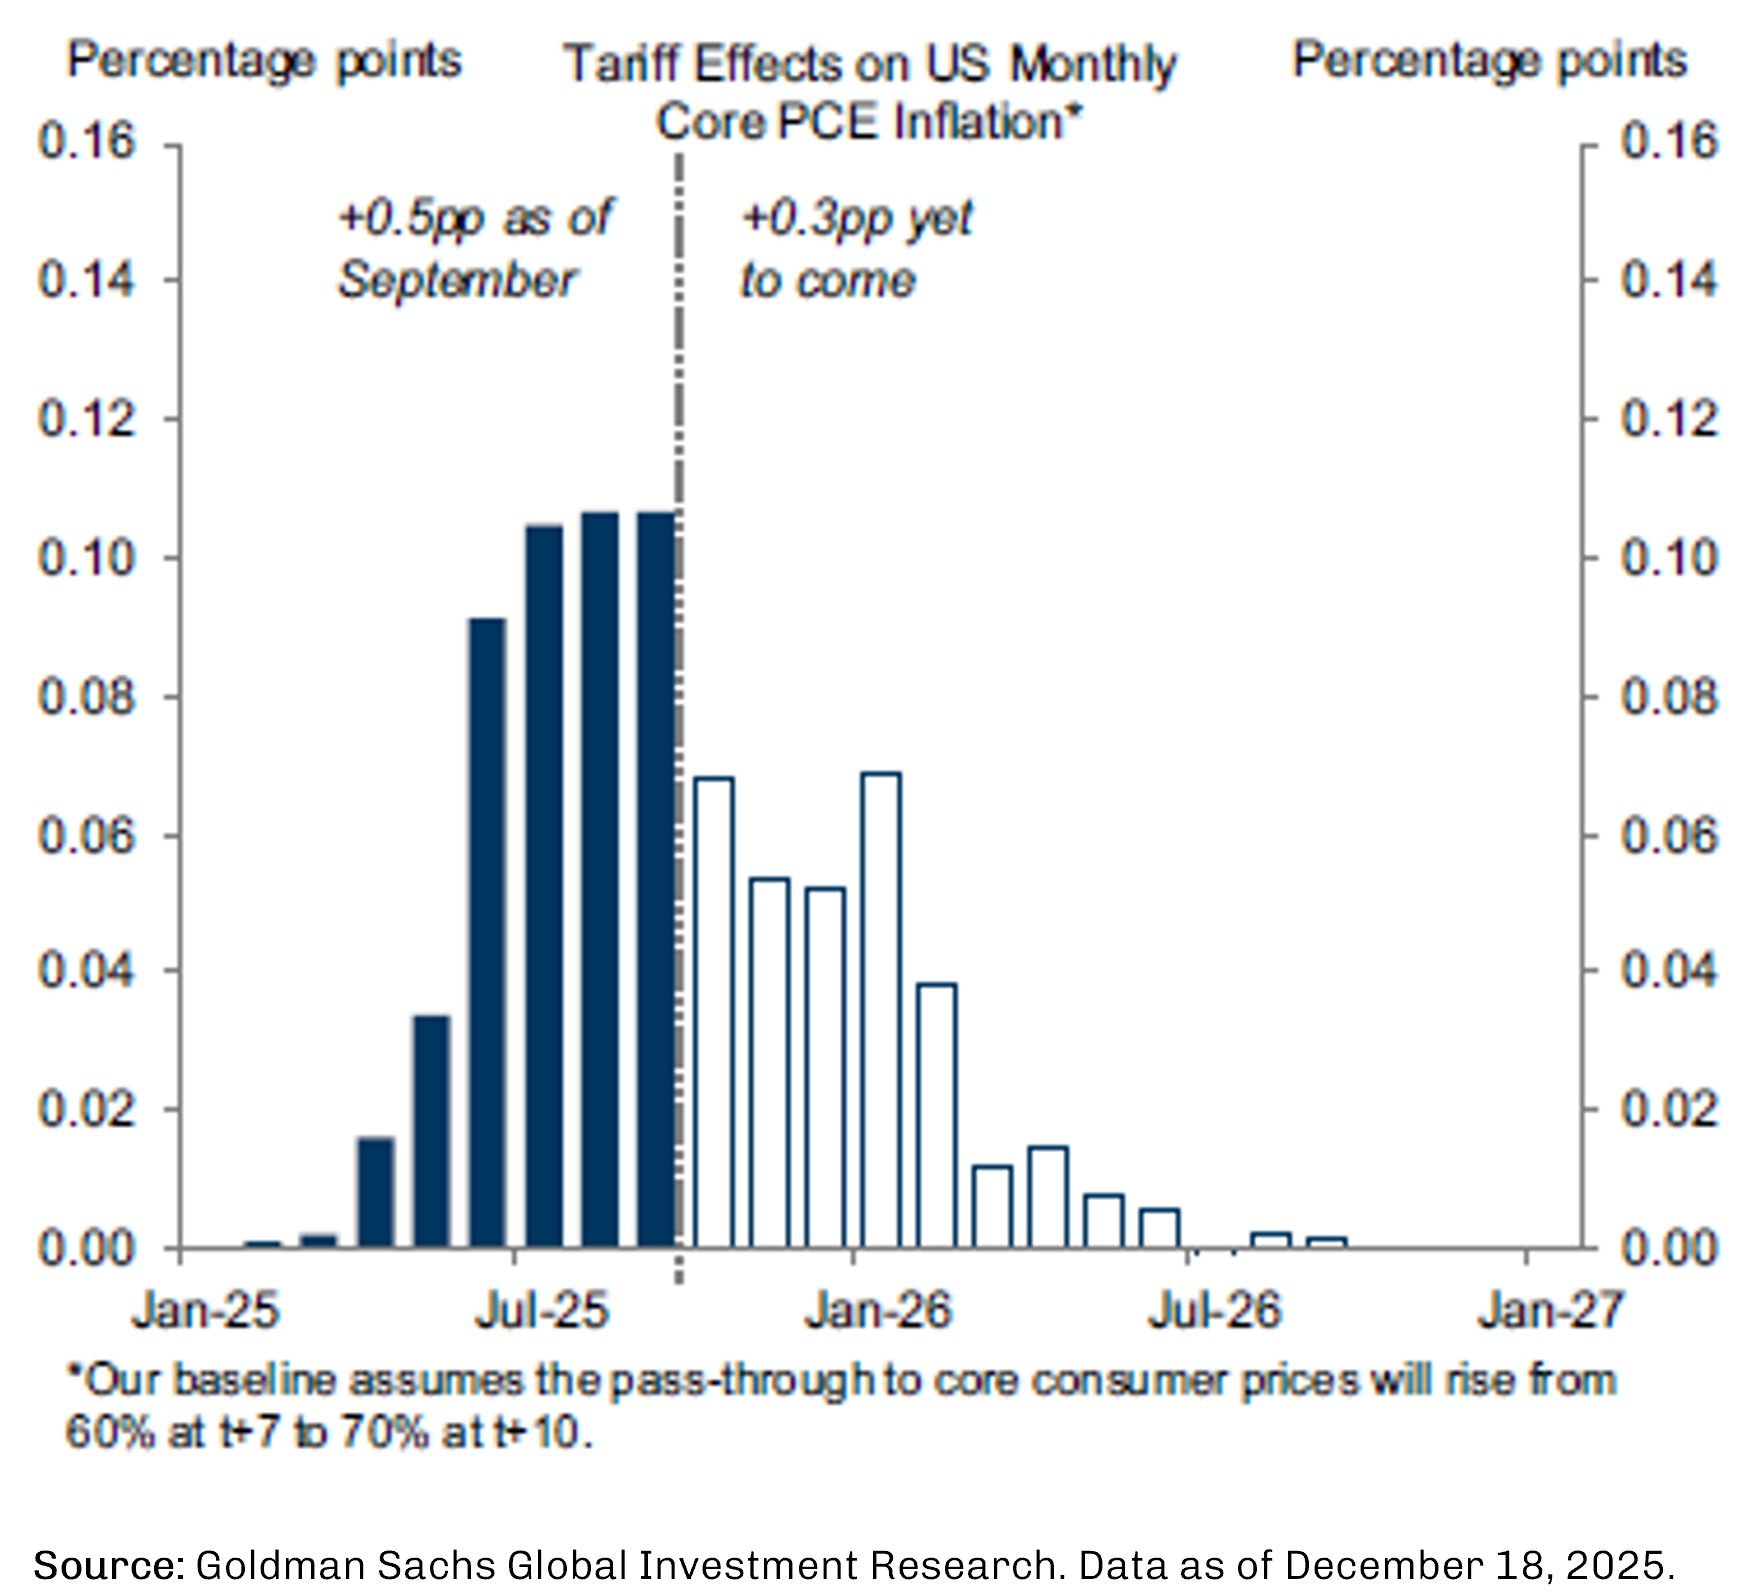
At the same time, several research firms, including Goldman Sachs, have offered a more constructive counterpoint. Goldman’s analysis suggests that tariffs have added incremental basis points to recent inflation readings, particularly within core PCE, and that as those tariff-related effects roll off in 2026, inflation pressure should decelerate. In their framework, absent new policy shocks, underlying inflation dynamics would likely be closer to the Fed’s 2% target than recent data implies. Together, these opposing forces add uncertainty to the inflation outlook, with tariff relief pulling inflation lower while stimulus and investment push in the opposite direction.
AI remains the most consequential structural investment theme shaping markets, and its influence will likely extend well beyond 2026. That said, some market participants have questioned whether certain segments of the AI ecosystem exhibit characteristics associated with periods of elevated speculation. Several market observers have pointed out rapid price appreciation, elevated expectations, and speculative capital spending as signs of excess. History suggests that bubbles are rarely obvious in real time, and that they do not all end the same way. Even if the current cycle does not resemble past manias, structural risks within the AI trade are rising.
One important distinction from prior technology bubbles is the profitability of today’s market leaders. Returns on equity across the technology sector are materially higher than during the dot-com era, and valuations, while elevated, remain well below the extremes reached in 2000.
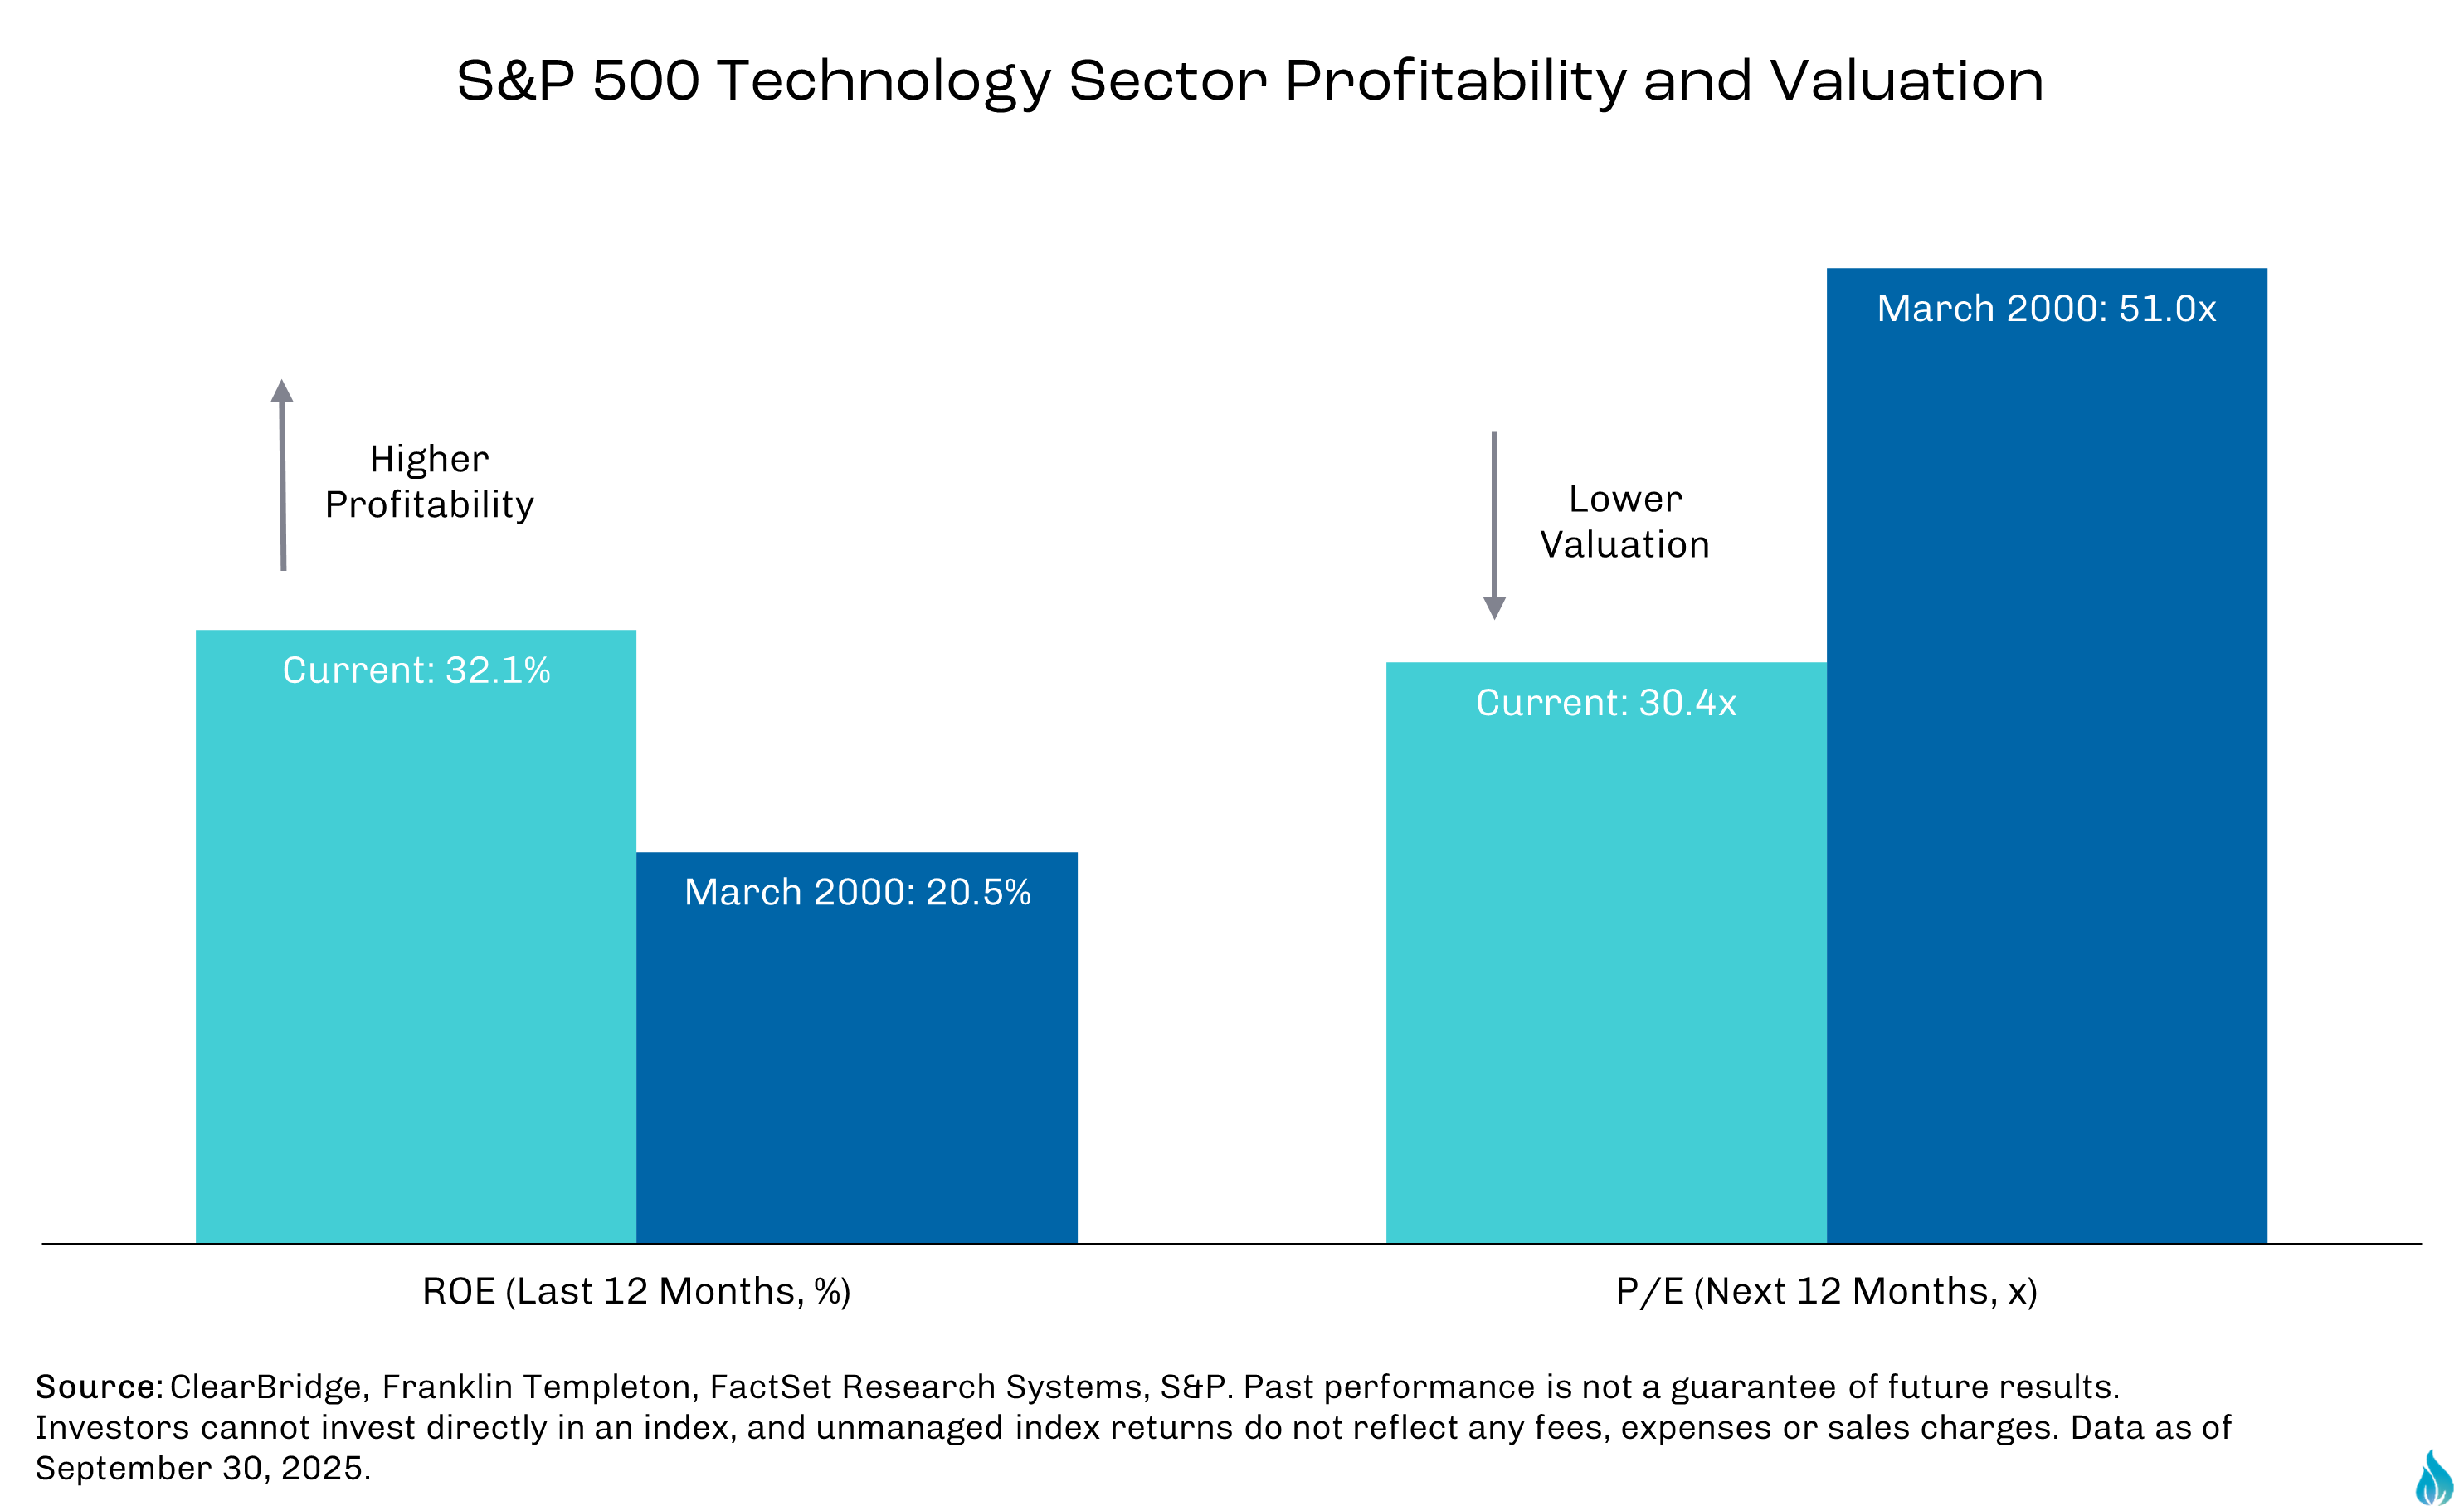
This profitability has allowed companies to fund aggressive investment internally rather than relying on fragile external financing, reducing the likelihood of a sudden investment freeze driven purely by tighter financial conditions.
At the same time, the market appears to be more discerning than in past speculative cycles, actively penalizing behavior that resembles late-stage bubble dynamics. Several high-profile examples illustrate this. Oracle’s shares have faced pressure amid concerns about rising leverage and a high degree of revenue reliance on a small number of AI-related customers, including OpenAI. CoreWeave, an AI infrastructure company, has seen valuation scrutiny increase due to contract structures that tie revenue recognition and cash flow to specific usage and performance metrics, raising questions about payment certainty and balance-sheet risk. Meta has also underperformed at times as investors reassessed the pace of AI spending relative to near-term returns. These reactions may suggest that capital markets are not indiscriminately rewarding AI exposure, but are increasingly sensitive to funding structure, customer concentration, and return on invested capital.
The scale of capital deployment nonetheless remains substantial. Hyperscalers are investing hundreds of billions of dollars annually in data centers, networking, and compute infrastructure, yet consensus estimates suggest they will remain free-cash-flow (FCF) positive even after dividends.
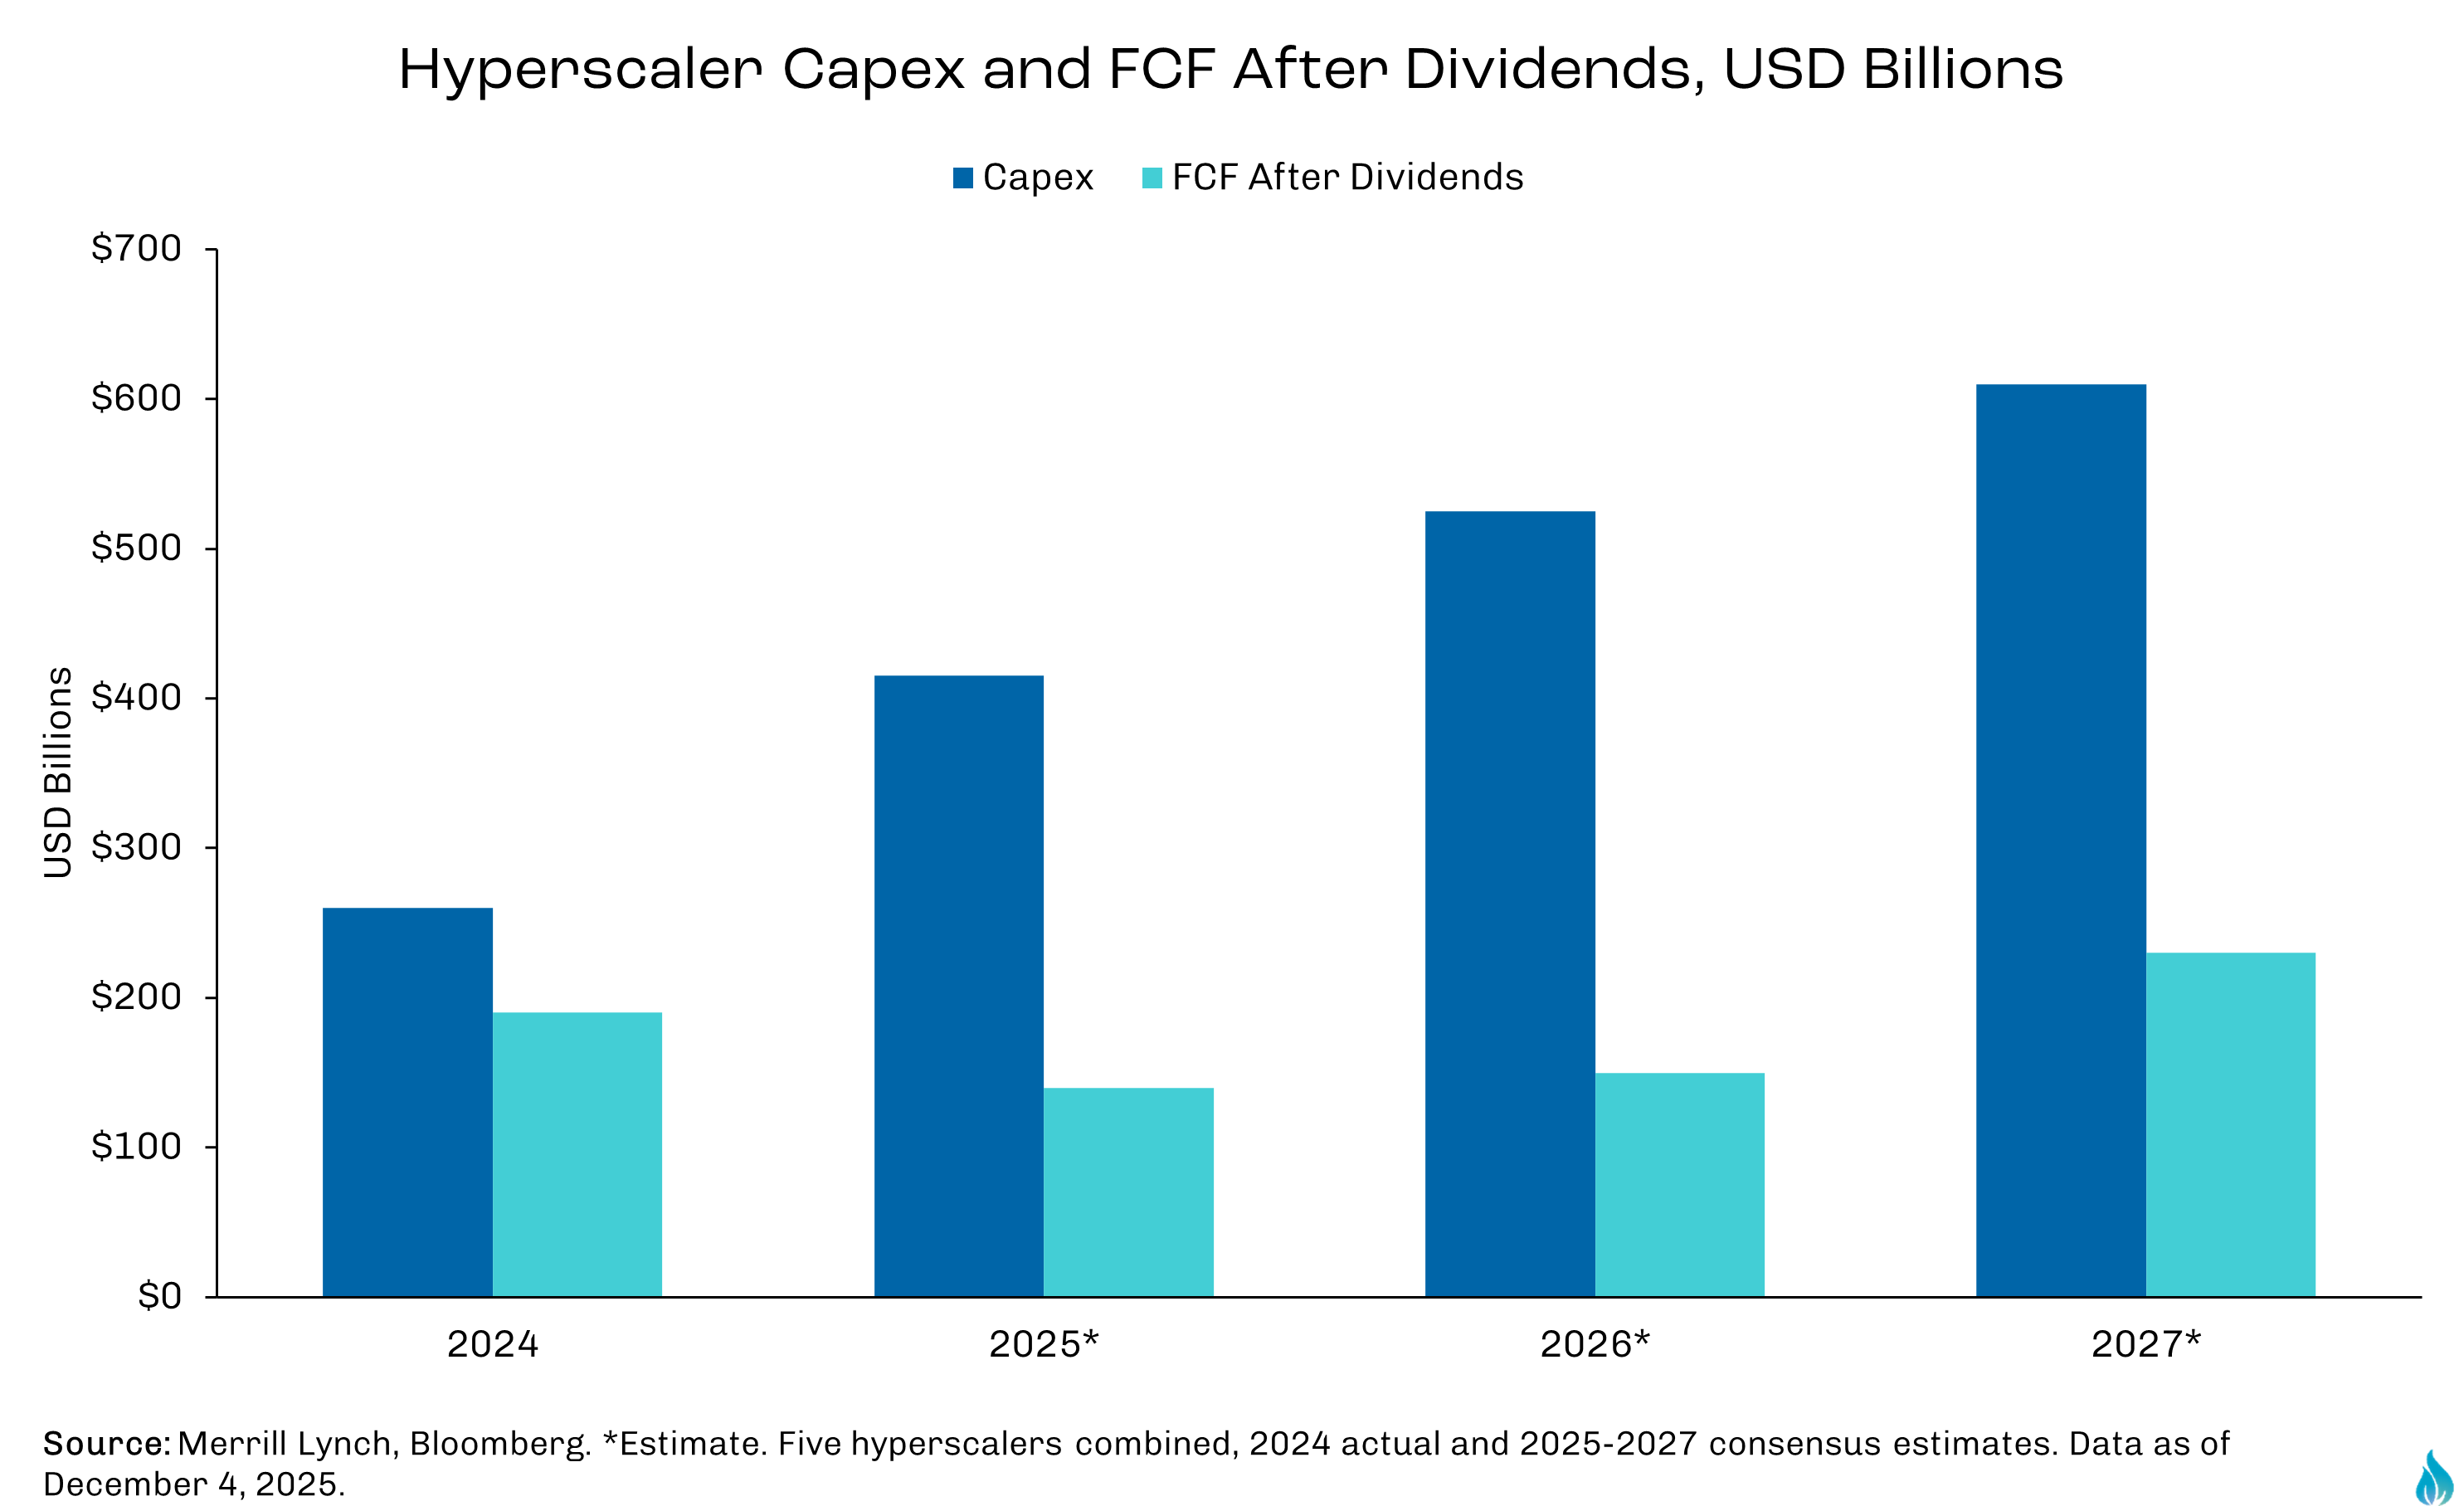
This spending capacity supports the view that the AI build-out still has momentum, even as scrutiny around capital efficiency intensifies.
Public and private market deal activity suggests the AI investment cycle is evolving rather than stalling. In late 2025, Groq announced a non-exclusive inference technology licensing agreement with Nvidia, widely reported at approximately $20 billion by major financial media. Rather than a traditional acquisition, the structure underscores the strategic importance of inference as AI adoption shifts from model training toward deployment and real-time applications. Several analysts have noted that inference workloads, which currently represent a smaller share of AI compute demand, could become a primary driver of spending over the coming years. Private market activity reinforces this view, with deal flow remaining concentrated in infrastructure, semiconductors, and enabling technologies, indicating that capital continues to target the foundational layers of the AI ecosystem rather than purely speculative applications. This pattern supports the view that AI investment remains part of a broader capital cycle, not simply a sentiment-driven trade.
At the same time, risks are clearly increasing. Market concentration within AI beneficiaries is high, revenue and capital spending across the ecosystem are increasingly interconnected, and expectations for continued growth are elevated. The dominant risk may not be an imminent collapse in AI spending, but rather a system that becomes more sensitive to execution missteps, regulatory changes, or shifts in demand assumptions. In this sense, AI in 2026 may be best understood as a structural growth theme with rising fragility, where opportunity remains significant, but the margin for error is narrowing.
For much of the past decade, investment returns were driven by an increasingly narrow group of large US technology companies. This dynamic, in effect, penalized investors who adhered to traditional diversification principles. It’s possible 2025 was a small bump in the road of the market’s most enduring trend but could also indicate the beginnings of a legitimate regime change. While the Mag 7 in aggregate still outperformed, international equities outperformed US large caps, precious metals delivered strong returns, US mid-cap stocks gained ground, and leadership within the S&P 500 broadened beyond the most heavily weighted names.
These shifts did not occur in isolation. They reflected improving fundamentals, valuation discipline, and a market increasingly sensitive to concentration risk. By the numbers, the change was notable. In 2025, the MSCI ACWI ex-US Index posted 33.0%, outpacing the S&P 500. Developed international markets, led by Japan and parts of Europe, were up 31.4%, while emerging markets finished the year up 33.2% after a prolonged period of underperformance. Taken together, these outcomes marked one of the clearest shifts in recent years that are being accounted for in portfolio strategy for 2026.
With that said, we do not currently see a need to materially reduce exposure to US equities or exposure to AI related themes. Instead, we look to further balance portfolio risk. Fortunately, this may be the first time in years doing so may improve portfolio balance and risk characteristics, though the additional benefit of potential outsized returns cannot be guaranteed.
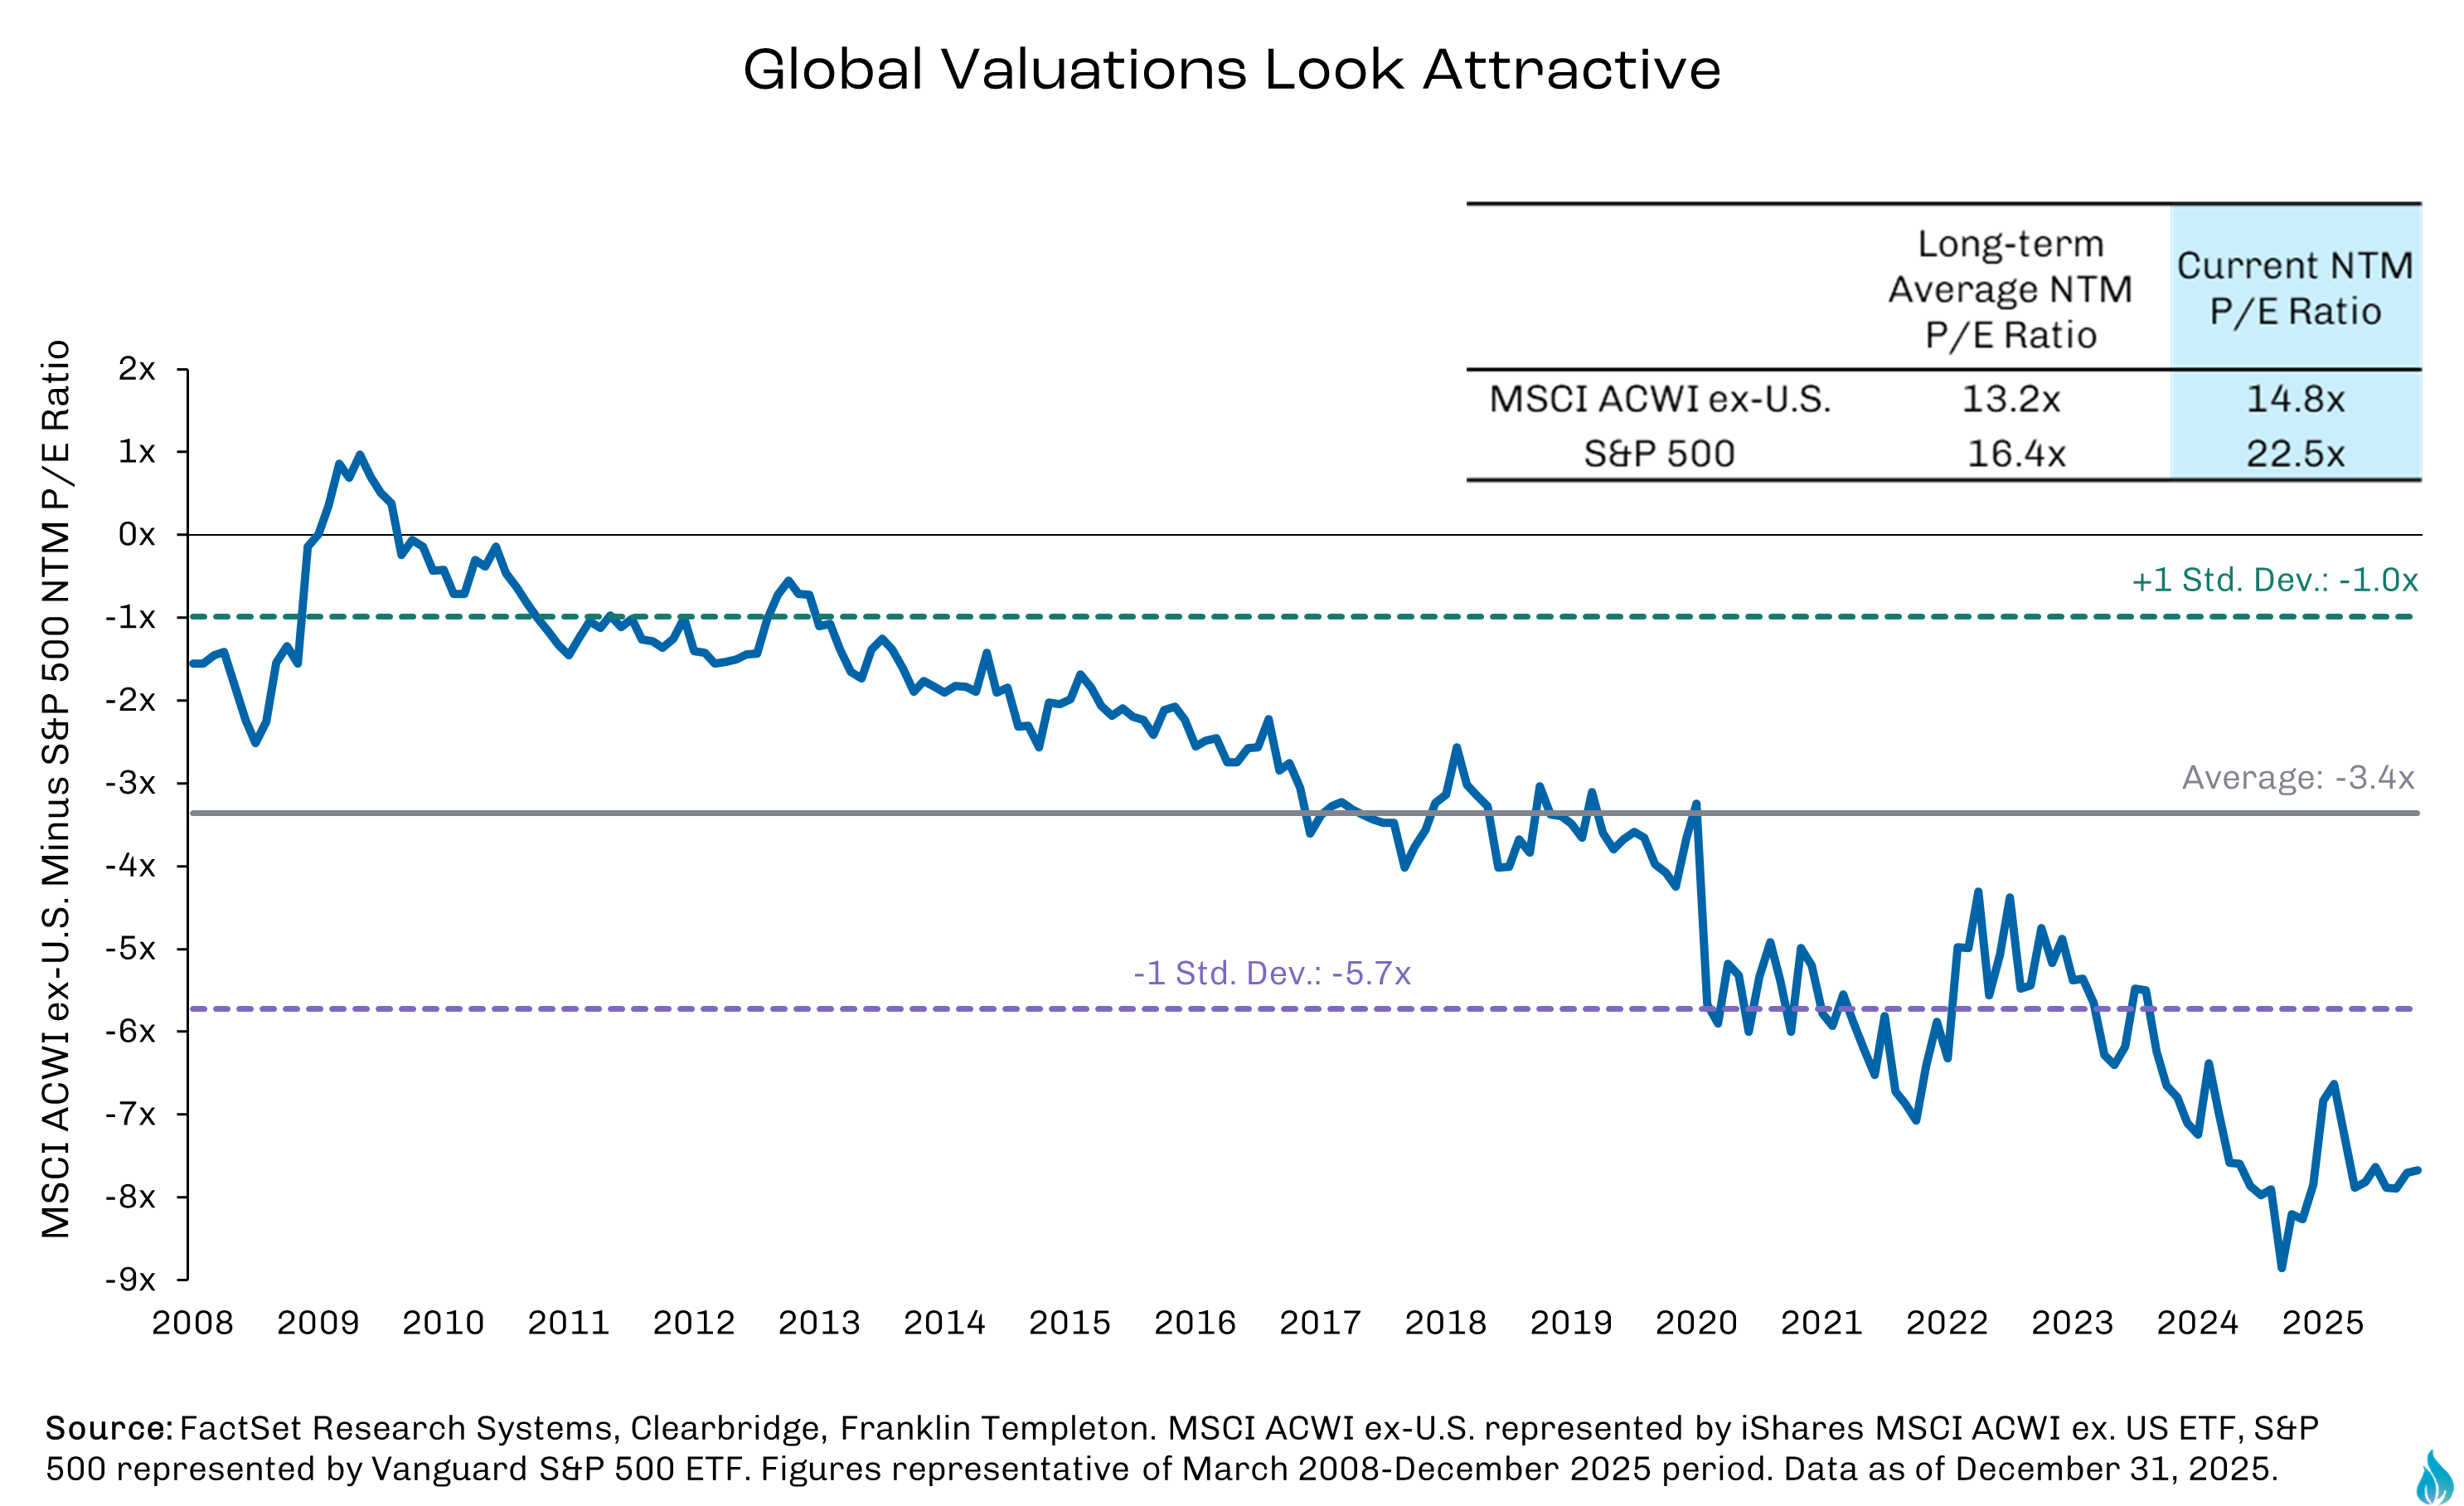
The valuation case for doing so is relevant. Though lower valuations do not necessarily imply superior future performance, international equities trade at a significant discount to US stocks on both absolute and historical measures. Forward price-to-earnings multiples for developed international markets remain several turns below those of the S&P 500, while emerging markets trade at even steeper discounts.
Valuations alone do not drive returns, but they matter when combined with improving fundamentals. Several factors strengthen the case for looking outside the US in 2026.
1. Earnings growth is no longer uniquely American - Consensus estimates suggest that earnings growth in parts of Europe, Japan, and select emerging markets is converging with US growth rates, despite much lower starting valuations. This convergence narrows the justification for persistent valuation premiums and increases the sensitivity of relative returns to modest improvements in global growth.
2. Global stimulus is increasing - Fiscal spending tied to defense, energy security, infrastructure, and industrial policy is rising across Europe and Japan. China has also signaled renewed support for growth through targeted fiscal and monetary measures. These initiatives can support domestic demand and corporate earnings outside the US at a time when US fiscal impulse is expected to peak in 2026 and fade thereafter.
3. Currency dynamics may become less of a headwind - Historically, periods of declining US interest rates have coincided with a weaker dollar. While currency movements are inherently difficult to forecast, a less restrictive Fed reduces one of the most persistent challenges facing international and emerging market returns over the past decade.
4. Market composition provides diversification benefits - International equity indices are far less concentrated in a small group of technology and AI-related companies than the S&P 500. Broadening into international equities allows portfolios to maintain exposure to long-term innovation through US large cap stocks while reducing correlation, concentration, and valuation risk.
Periods following extended US outperformance have often included phases of relative international leadership, particularly when valuation dispersion was wide and global growth broadened. Importantly, international outperformance does not require US underperformance. Both can perform well simultaneously, with leadership rotating rather than collapsing.
For investors, this is not an all-or-nothing call on the US versus the rest of the world. It is about improving the balance and resilience of portfolios in an environment where dispersion is likely to rise, and returns may be earned from a wider set of opportunities than in recent years.
The most disruptive risks are often not the ones dominating headlines, but those that are less obvious, poorly anticipated, or underestimated by markets. While it is impossible to forecast every shock, identifying areas where expectations are tightly clustered or outcomes are asymmetric can help frame the risks that matter most for investors.
1. Geopolitical risks and energy-price shocks - Investing in anticipation of specific geopolitical outcomes is usually a risky proposition, but failing to account for the possibility of sudden shocks can be equally foolish. A resolution to the Russia–Ukraine conflict could act as a market catalyst, while renewed escalation or broader involvement could disrupt risk assets, particularly through energy markets. Developments in Venezuela also require close attention. Uncertainty around leadership transitions and further military involvement have major implications for the region and global oil supply. A sharp rise in energy prices remains one of the more direct ways to upend inflation progress and consumer confidence. Continued unrest in the Middle East remains a wildcard, though recent events suggest less systemic risk to global stability than in prior cycles.
2. Artificial intelligence exuberance - While AI remains a powerful structural growth theme, the market structure around AI has become increasingly sensitive. Risks include an abrupt slowdown in capital spending, a broad market re-rating of AI beneficiaries, or an unforeseen disruption tied to concentration and interdependence within the ecosystem. The concern is less about demand disappearing overnight and more about how quickly sentiment and valuations could adjust in response to disappointment.
3. Further deterioration in the U.S. labor market - A gradual cooling in the labor market is consistent with a soft landing, but a sharper deterioration could weigh on confidence, spending, and credit conditions more quickly than expected. Given the uneven distribution of wage growth and savings, weaker employment conditions could transmit through the consumer in non-linear ways, even if aggregate data initially appear resilient.
4. Policy shocks and fiscal uncertainty - Beyond their direct economic impact, policy changes can raise uncertainty and keep risk premiums elevated. One underappreciated risk is that tariffs have become increasingly intertwined with current fiscal policy, contributing meaningfully to government revenue. An abrupt rollback or legal reversal of tariffs could create unexpected pressure on the U.S. budget and deficit trajectory, potentially prompting offsetting fiscal measures or renewed policy volatility.
5. Inflation re-acceleration and a shift in Fed policy expectations - A key risk is not simply inflation drifting higher, but the Fed’s likely action to reverse policy and hike interest rates. If inflation proves stickier than expected due to stimulus, tariffs, or renewed demand strength, expectations for a dovish policy path could reverse, tightening financial conditions and challenging both equity and bond markets.
Overlaying all of these risks are elevated asset price valuations. High valuations inherently increase potential downside. This underscores why diversification, discipline, and balance matter in the current environment. The goal is not to predict the next shock, but to build portfolios that are resilient to a wider range of outcomes than markets may currently be pricing.
While every year brings with it new opportunities and risks, portfolio positioning and strategy is a continuous process. For example, within our portfolio frameworks, fixed income exposure was adjusted over time, broadening duration through mortgage-backed securities (“MBS”), long-term Treasuries, and longer-dated investment-grade bonds.1 Higher starting yields and a potential shift toward easier monetary policy improve the risk-reward profile of high-quality fixed income.
We remain overweight to US large cap equities with a thematic focus on AI, while counterbalancing risk by leaning further into international equities with an emphasis on emerging markets. We upgraded our SMID cap equity positions at the beginning of last year, and despite recent underperformance we have maintained the allocation based on our assessment of relative valuations and interest-rate sensitivity.
Portfolios have benefitted from significant absolute returns from gold since we initiated the position in 2024. We maintain exposure to gold as we enter 2026 as a tactical diversifier, while still recognizing that recent outsized gains are unlikely to persist indefinitely. We view gold’s role in portfolios as a hedge against policy uncertainty and geopolitical risk, not as a long-term growth asset. With that said, ongoing monitoring and rebalancing discipline will guide realization decisions, particularly where position sizes warrant trimming.
We have been proactively making portfolio adjustments, when appropriate, to client portfolios in late 2025 to account for much of our perspective outlined in this note. Depending on individual tax situations, further rebalancing in early 2026 may be more significant as we stretched out capital gain realization for certain client portfolios.
2026 does not require investors to choose between optimism and caution. It requires both.
We remain encouraged by a broadening opportunity set and a policy backdrop that may be more supportive than many expect. At the same time, elevated valuations, high earnings expectations, and rising structural risks argue against complacency.
In our view, staying invested while staying balanced remains the most effective way to navigate a year that is likely to deliver returns that are more modest, more volatile, and more dispersed than recent years.
1 As part of our ongoing portfolio management process, allocations may be adjusted over time based on evolving market conditions and individual client circumstances. Individual client positions may vary from model portfolios.

Michael is the founder of Fire Capital Management.
.png)
