Written by
Kelsey Syvrud, PhD
Written by
Kelsey Syvrud, PhD
Published on
November 13, 2025
Category
Investment Insights
As we approach 2026, financial markets face a landscape characterized by accommodative monetary policy globally and opportunities that go beyond geographic boundaries. Following an extended period of U.S. equity dominance, 2025 has marked a striking rotation in global financial markets. International equities have significantly outperformed U.S. equities year-to-date, reversing a historic multi-year trend. This rotation has been driven by valuation disparities, U.S. dollar (USD) weakness, trade policy uncertainty, and improving fundamentals in non-U.S. markets. Could this be the end of a historic period of U.S. financial market exceptionalism? Must all good things really come to an end?

Since 1975, U.S. and international equity markets have alternated leadership in cycles averaging more than eight years in duration. The cycle of U.S. outperformance that began in 2010 has nearly doubled the historical average and is the longest period on record. This unprecedented duration, combined with extreme valuation disparities, begs the question of whether we may be witnessing the early stages of a meaningful reversal rather than a temporary deviation.

Understanding the current rotation from U.S. to international equities requires placing it within the broader historical context of market leadership cycles. The relationship between U.S. and international equity performance has seen periods of dominance by one region ultimately giving way to sustained reversals. Evaluating these past cycles can provide insights into the expected longevity and durability of the recent international outperformance.
The 1970s represented a period of international equity outperformance, driven by economic dislocations in the U.S. From 1970 through the end of the decade, international developed markets significantly outpaced U.S. equities, with particularly strong performance from 1973 - 1980.
The decade was defined by two severe oil shocks that exposed U.S. economic fragility: 1) the 1970s Arab Oil Embargo, and 2) the 1979 Iranian Revolution. These events led to staggering increases in oil prices and shocked energy-import-dependent economies. At the same time, the U.S. was forced to import more oil. In 1970, the U.S.’s domestic oil production far exceeded the production of Saudi Arabia and Russia combined. Subsequently, U.S. production declined, forcing net imports to more than double by 1976. This shift gave OPEC significant pricing power and market share, fundamentally undermining the prior U.S. economic advantage.
Additionally, this period was marked by “stagflation” in the U.S., with the country experiencing the worst of both rampant inflation and recession. Nixon-era price controls and economic mismanagement exacerbated the stagflation crisis, creating conditions particularly adverse for U.S. equities. Adding fuel to the fire, Nixon's 1971 decision to abandon the Bretton Woods gold standard triggered sustained U.S. dollar weakness throughout the decade. This weak dollar increased costs for U.S. companies with foreign assets and made international equities more attractive to dollar-based investors.
This period of international outperformance established some clear lessons: 1) U.S. market leadership was not permanent, 2) dollar weakness creates powerful tailwinds for international assets, and 3) commodity/energy dynamics can drive regional performance.
While the U.S. was weak, Japan’s market was growing rapidly, capturing a significant portion of global market capitalization. As a result, the mid-to-late 1980s witnessed one of history's most spectacular bull markets, and subsequent bubbles, in Japan. The Plaza Accord fundamentally altered currency relationships and set in motion events that would drive this historic bubble. The accord aimed to address massive trade imbalances, particularly the U.S. trade deficit and Japanese trade surplus, by coordinating central bank intervention to weaken the U.S. dollar.
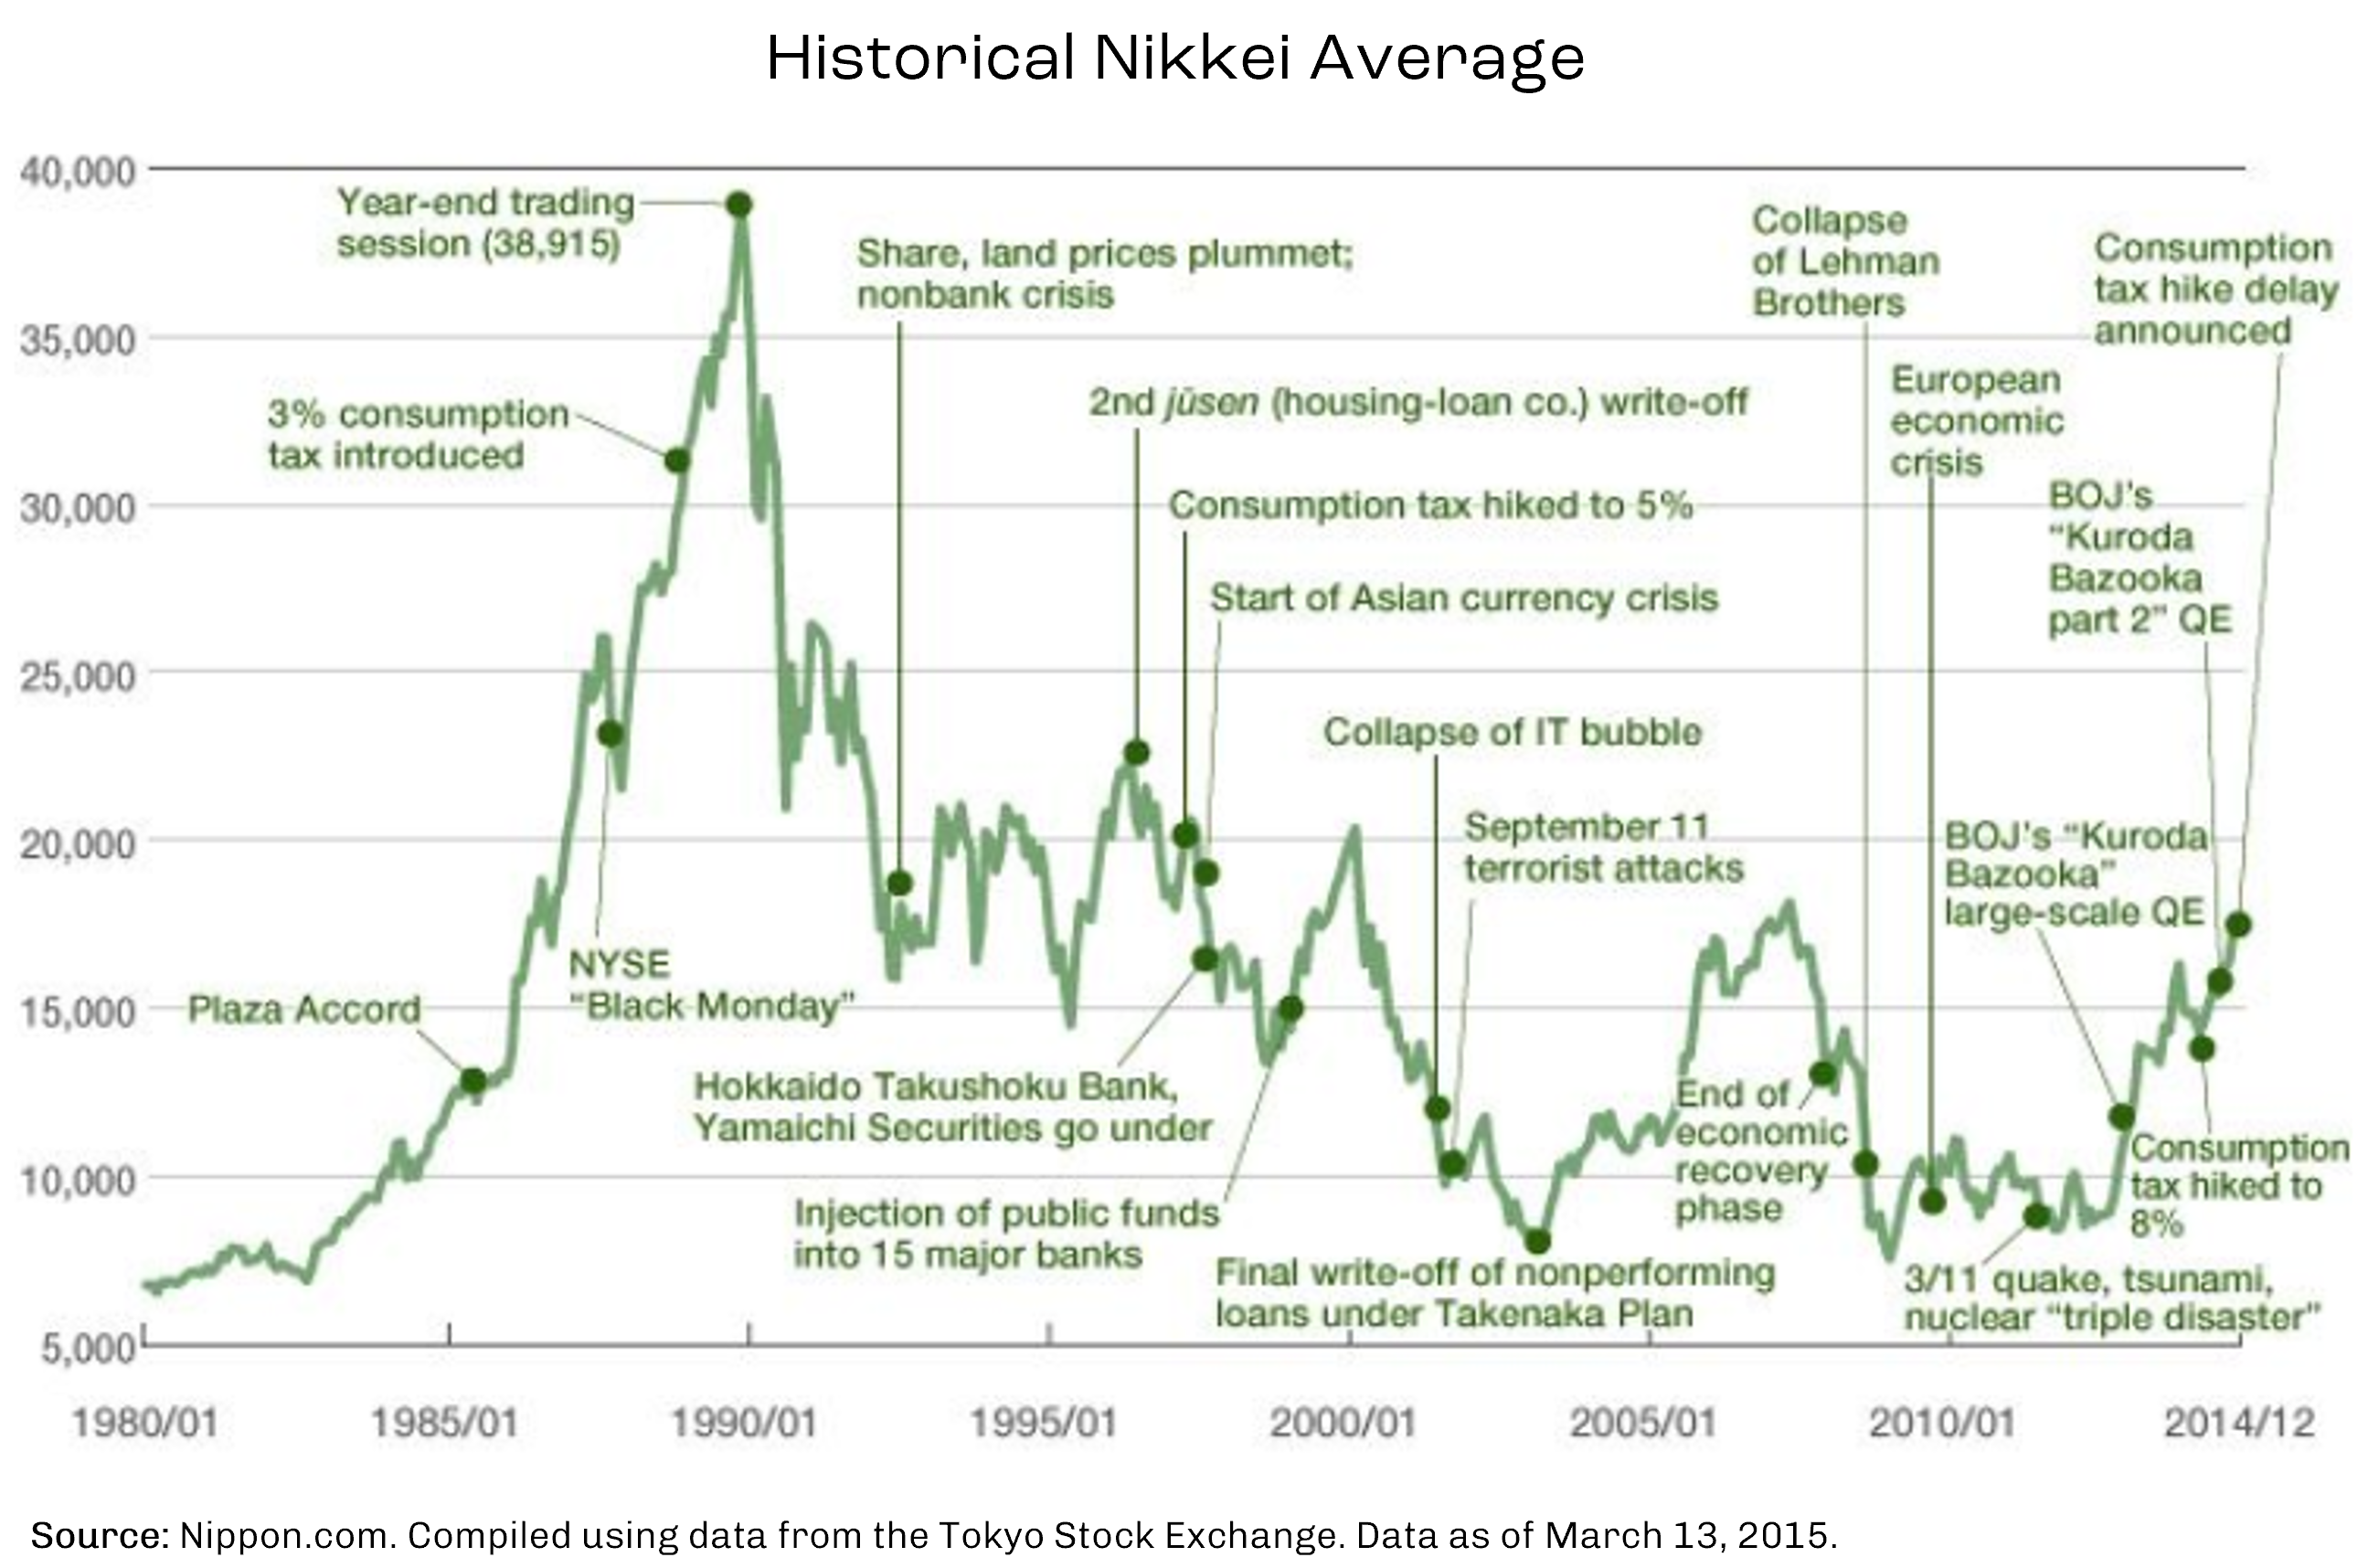
As planned by the Plaza Accord, the yen appreciated dramatically, with the yen nearly doubling in value against the dollar from 1985 to 1987. This rapid appreciation threatened Japan's export-dependent economy, causing GDP growth to decelerate. At the same time, poor demographics and negative population growth also affected domestic demand. To counter recession risks, the Bank of Japan (BOJ) slashed interest rates and loose monetary policy, combined with financial deregulation and excess liquidity, fueled the historic asset price bubble. However, beginning in 1990, the bubble burst, with the Nikkei ultimately declining 80% by 2003. Japan entered its “Lost Decades” era, an extended period of stagnation, deflation, and underperformance that lasted until the mid-2010s. This Japanese experience demonstrates that extreme valuation expansions, even for a seemingly dominant economic power, are unsustainable and can lead to multi-decade underperformance.
As Japan’s momentum faded, the U.S. reclaimed the spotlight. The 1990s ushered in a new cycle of American dominance, driven by the technology boom and an expanding global economy.
During this time, the commercialization of the internet, personal computing, and software created entirely new industries dominated by U.S. companies (e.g., Microsoft and eBay). Further, globalization was in full swing, with U.S. companies becoming increasingly multinational. This globalization trend allowed corporations to benefit from emerging market growth while maintaining high margins. At the same time, at home the U.S. was experiencing a “goldilocks economy,” with low inflation, steady growth, and rising productivity. However, the same could not be said for international markets. Following Japan's bubble burst and subsequent deflationary spiral, international markets were facing several headwinds including contending with the Asian Financial Crisis, and European integration challenges amid a backdrop of slower economic growth.
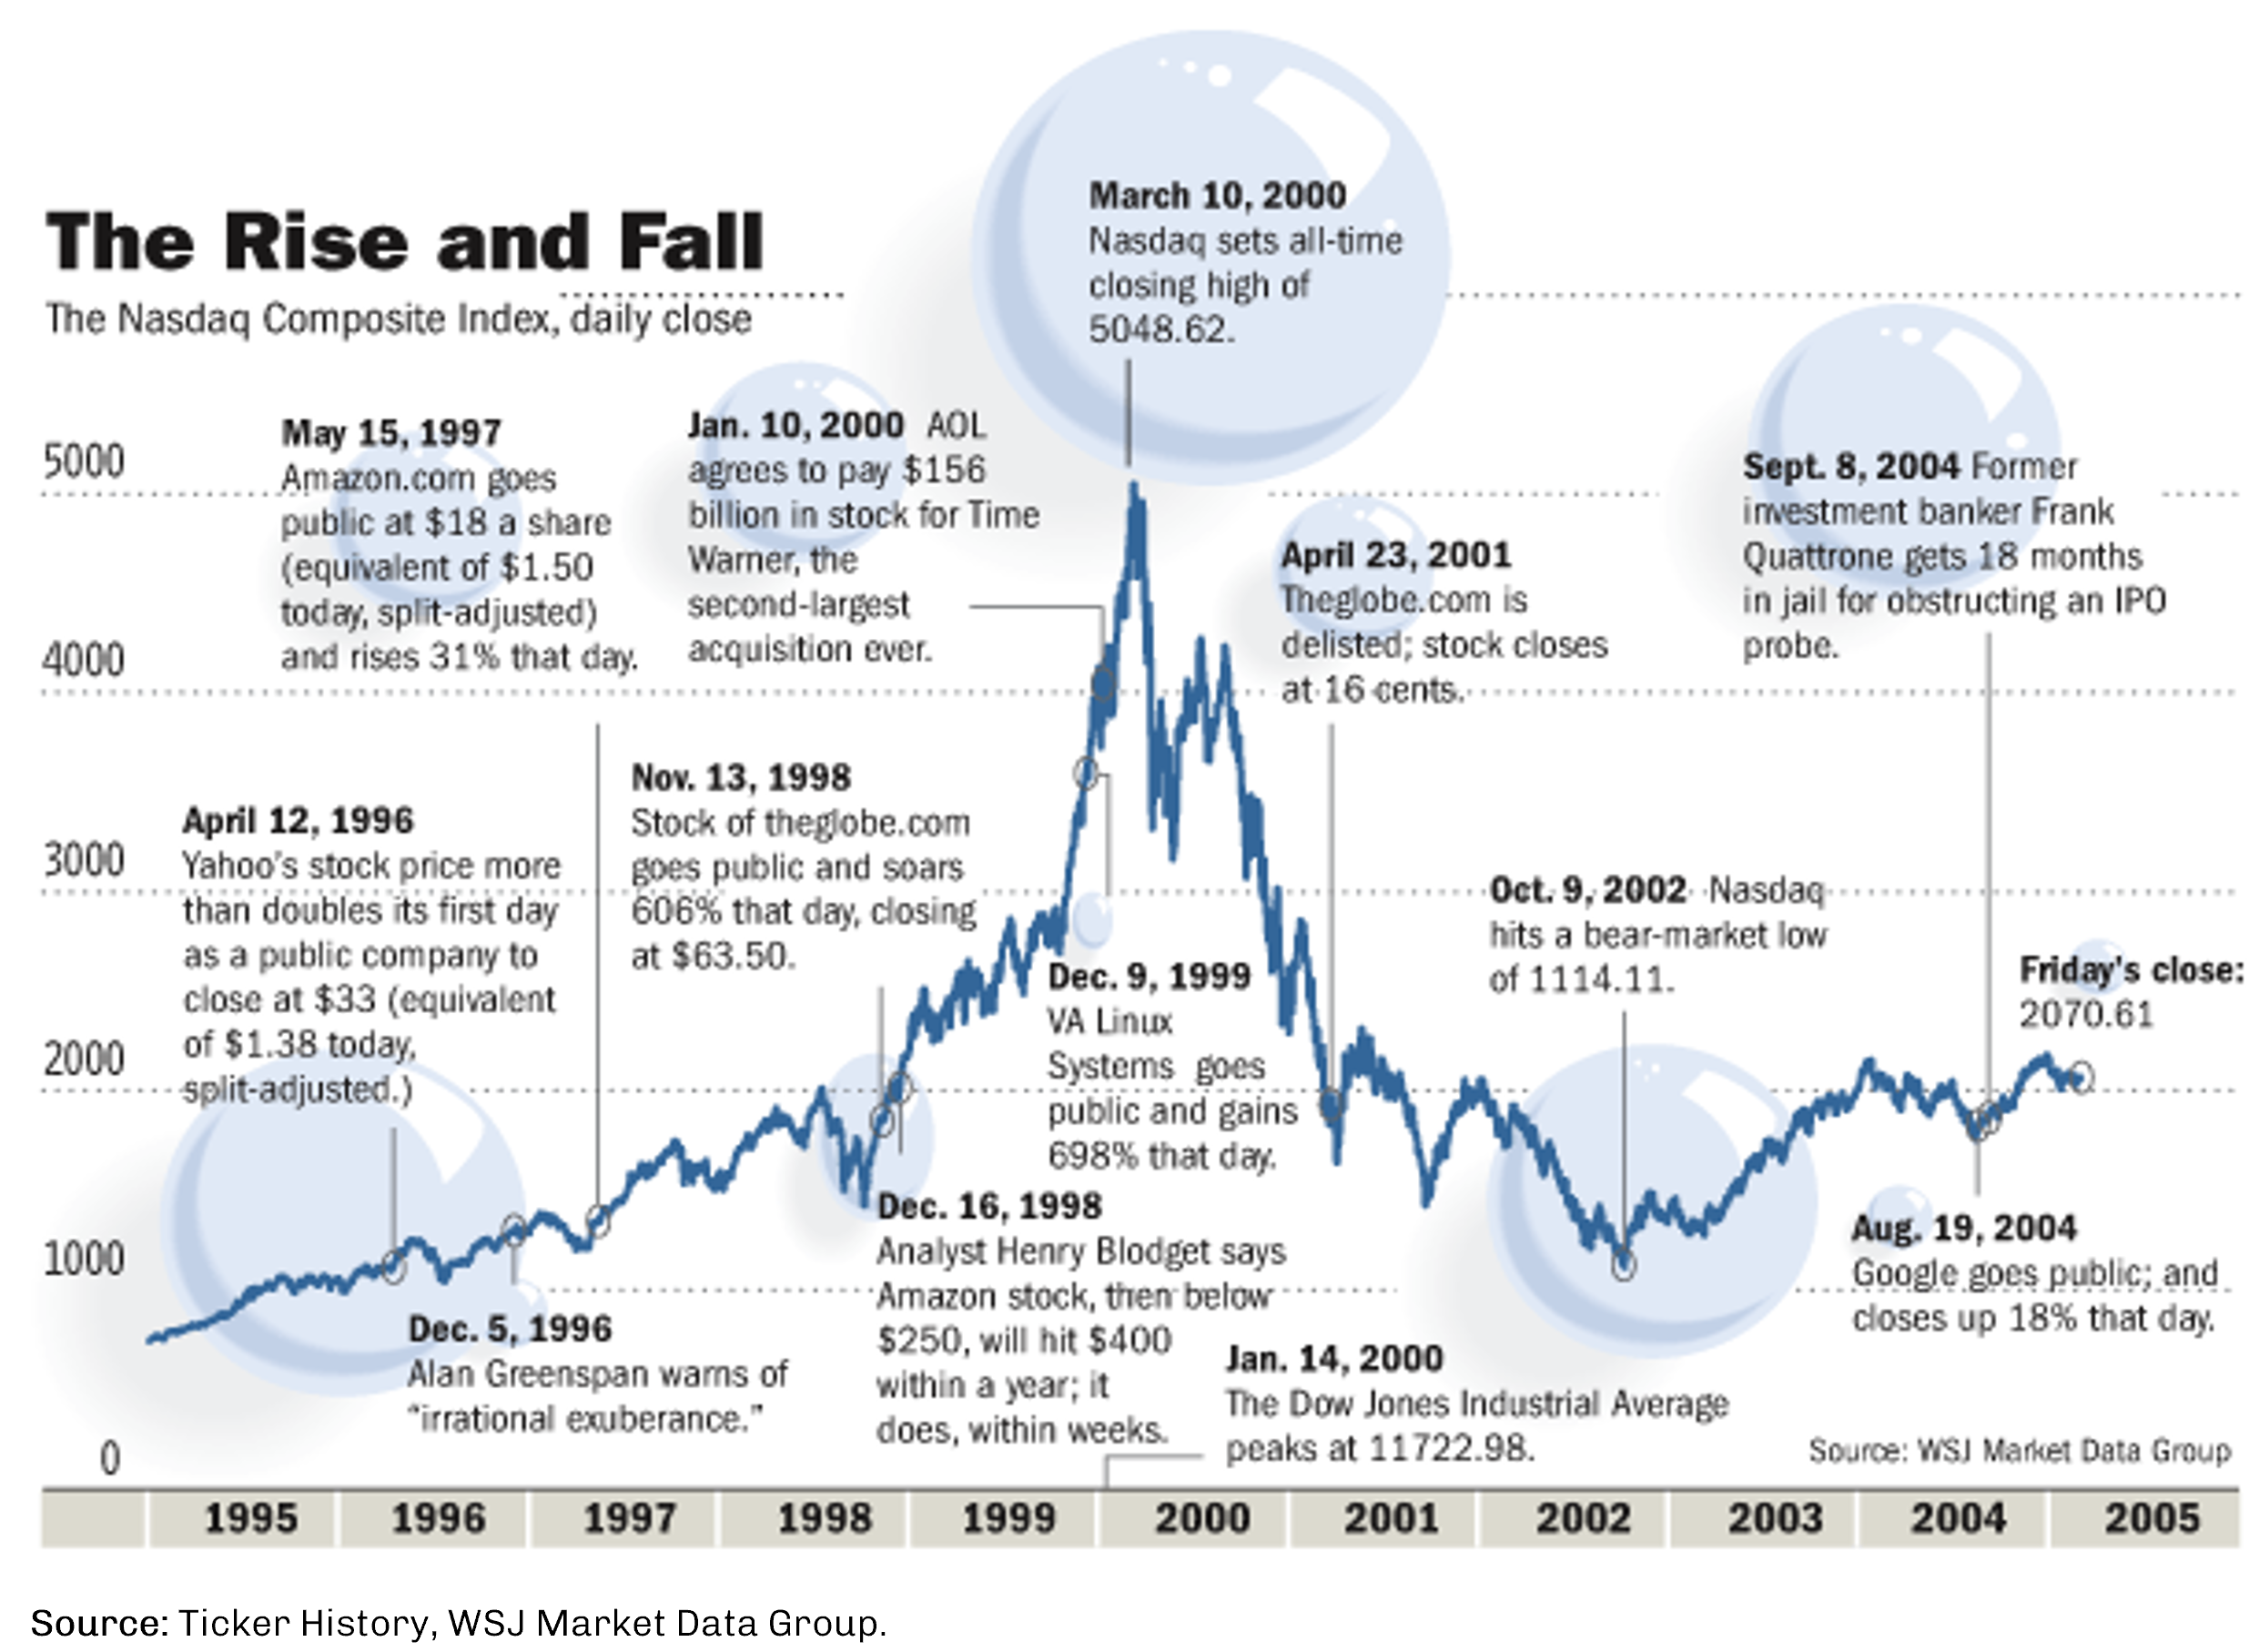
Eventually, much like Japan, the party stopped for the U.S. This era culminated in the dot-com bubble, with NASDAQ valuations reaching extreme levels before the March 2000 peak. Forward P/E ratios for technology stocks exceeded 100x, and many companies with no profits or even revenues commanded billion-dollar valuations. The collapse of this bubble ultimately reversed U.S. dominance once again.
The dot-com bubble led to a lost decade for U.S. equities. The 2000’s represented an extreme reversal in market leadership, with international equities (particularly emerging markets) significantly outperforming stagnant U.S. markets. The S&P 500 delivered essentially zero returns over the decade while emerging markets soared, with the MSCI Emerging Markets Index nearly doubling between 2000 and 2009.
There were several reasons for international outperformance during this time. To start, MSCI EAFE companies outearned S&P 500 companies leading up to the Great Financial Crisis (GFC). Specifically, international companies with higher revenue exposure to global GDP growth benefited from economic expansion. On top of this, U.S. equities started the decade at bubble valuations while international markets, which had lagged, offered investors relatively more value. Beyond stronger earnings and more attractive valuations, currency moves were once again in focus. The dollar declined significantly from 2002 – 2008, driven by rising current account deficits, the Iraq War spending, and loose monetary policy. This dollar weakness provided further support for international equities.
This period also experienced a commodity supercycle (i.e., a sustained, broad-based rise in commodity prices), which had not been seen since the 1970s and provided additional tailwinds for international markets. The primary catalyst for the supercycle was China’s significant growth. During this decade, China averaged 10.6% annual GDP growth as hundreds of millions moved from rural areas to cities, which required massive infrastructure investment. Concurrently, China became the "world's factory," requiring enormous inputs of steel, copper, aluminum, coal, oil and the country’s integration into global trade (e.g., joining WTO) only accelerated the demand for raw materials.

Commodity prices increased across the board and this boom created disproportionate benefits for emerging market commodity exporters such as Brazil, Russia, South Africa, Chile, and Indonesia. Developed commodity producers, including Canada and Norway, also outperformed. Broadly speaking, international indices had much higher weightings to commodity-producing companies and as commodities skyrocketed, these exposures drove higher returns.
However, all eras eventually come to an end. The GFC temporarily devastated global markets and ended the commodity supercycle, with oil plunging from $147 in July 2008 to $33 by December 2008. Although initially international markets recovered more quickly post-GFC, in subsequent years the U.S. pulled ahead to stage a comeback in market leadership.
The U.S. may have lost a decade, but international stocks lost nearly 15 years. From 2010 - 2024, U.S. equities delivered exceptional returns, with international stocks outperforming domestic in only 3 of 15 years. As mentioned previously, this period represents the longest continuous cycle of U.S. outperformance on record, at ~14.6 years.

During this stretch, the U.S. demonstrated superior economic growth. U.S. nominal GDP doubled from June 2008 to December 2024, significantly outpacing developed markets. This economic growth, boosted by productivity gains and policy effectiveness, translated directly into corporate earnings. Further, technology network effects allowed dominant platforms in the U.S. to aggregate profits and maintain market leadership, even amid a weak global business cycle.
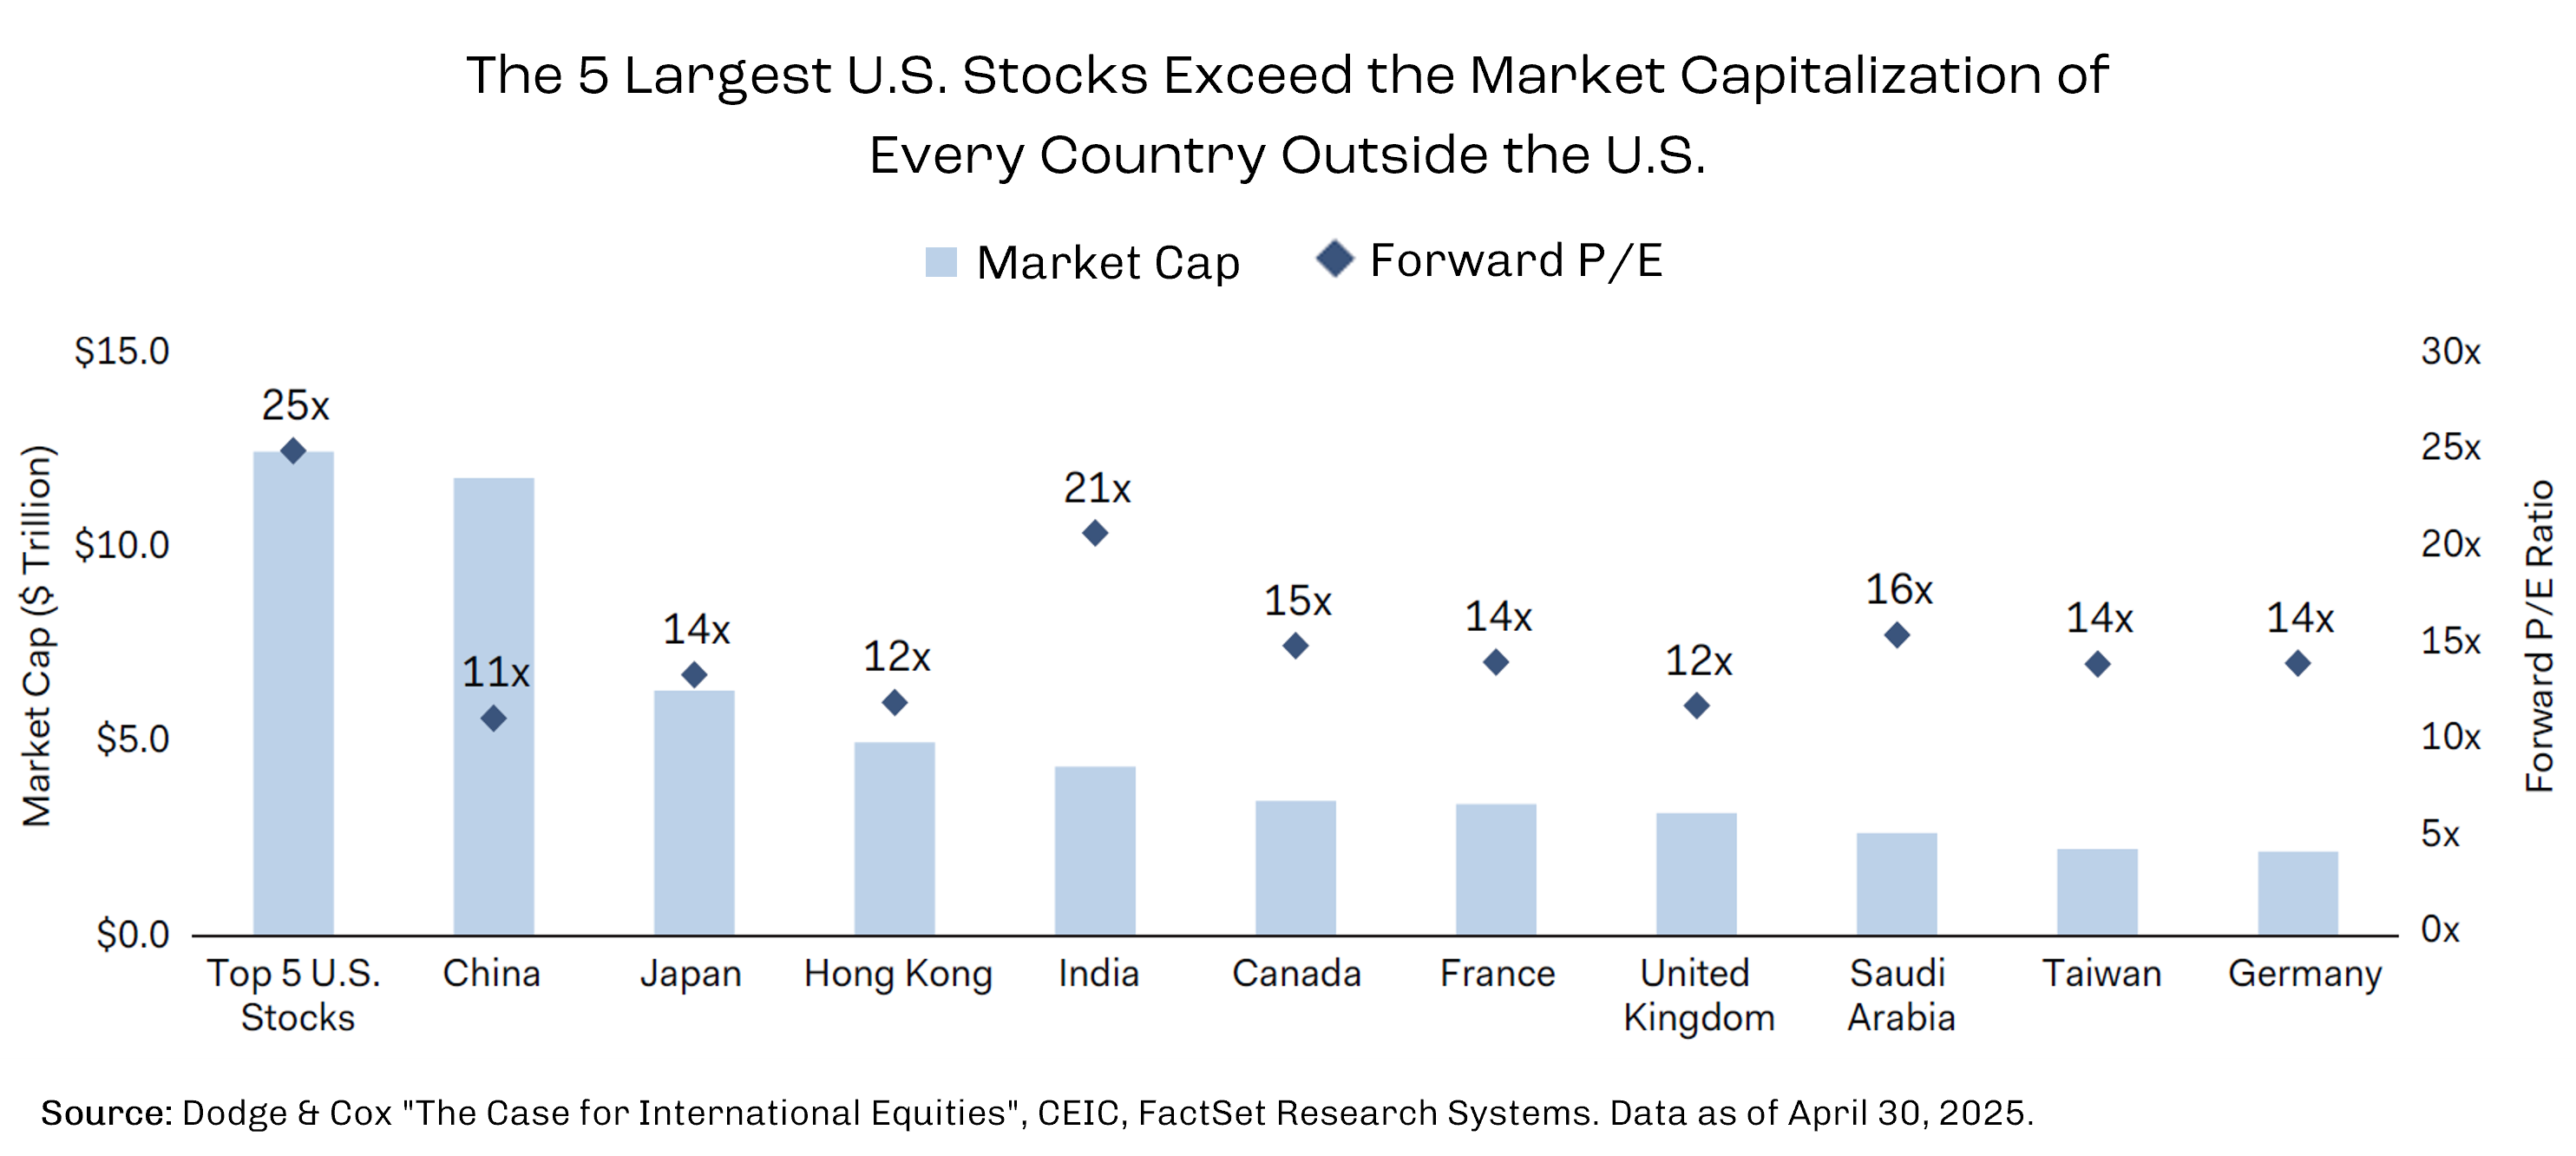
In general, the U.S. demonstrated a superior ability to translate GDP growth into corporate earnings with U.S. companies maintaining substantially higher margins. And speaking on technology, the end of this cycle was characterized by the rise of the “Magnificent 7” stocks, which has shifted market dynamics over the last few years. For example, by 2024, these seven stocks alone exceeded the combined market capitalization of all European equities, and the technology sector weight in S&P 500 reached 36%. The outperformance of these tech stocks and the ongoing AI boom has contributed to strong U.S. market returns in recent years.
But GDP growth and corporate earnings were not the only factors in play. Approximately two-thirds of U.S. equity outperformance from 2008 - 2024 stemmed from valuation expansion rather than earnings growth. This valuation expansion contributed nearly 4% annually to U.S. returns, exceeding the contribution from earnings growth. In other words, investors paid more per dollar of earnings, driven by the "growth at any price" mentality and TINA ("There Is No Alternative"). Other contributing factors included a favorable tax environment and U.S. dollar strength. The 2017 Tax Cuts and Jobs Act reduced the U.S. corporate tax rate from 35% to 21%, providing a significant earnings boost while strong dollar appreciation created a major headwind for dollar-based international investors.
And while the U.S. thrived, international markets lagged. Austerity policies overseas were constraining growth at a time when many international countries were also facing both weak demographics and productivity growth. The Sovereign Debt Crisis in Europe created serious questions about the future of the euro and uncertainty leading up to and following Brexit (the United Kingdom’s decision to leave the European Union) produced more headwinds for the region. Meanwhile, Japan faced continued deflationary pressure and aging demographics with workforce shrinkage.
Moreover, problems were not confined to developed markets. In emerging markets, China faced a slowdown in GDP growth as its economy matured. Commodity prices collapsed dragging down commodity-linked economies, while the dollar’s strength created debt servicing challenges for emerging market borrowers, and political instability (e.g., Brazil, Turkey, Russia, and Argentina) made it hard for these emerging financial markets to thrive.
All signs appeared to point to a systemic persistence of U.S. outperformance and portfolio allocations reflected that. Coming into 2025, U.S. investors were broadly under allocated to international markets, with many (Fire Capital included) having strong conviction towards sustained U.S. market exceptionalism. It seemed as though all good things did not need to come to an end when it came to U.S. markets.

But now, in late 2025, the investment community is once again roiling over the question of whether market leadership is reversing. The first half of this year witnessed a strong reversal with the performance picture completely inverting. As of October 31, 2025, emerging and developed markets are up +26.0% and +29.8%, respectively. In contrast, while U.S. markets are still positive for the year (+17.5%) they are significantly trailing international indices.
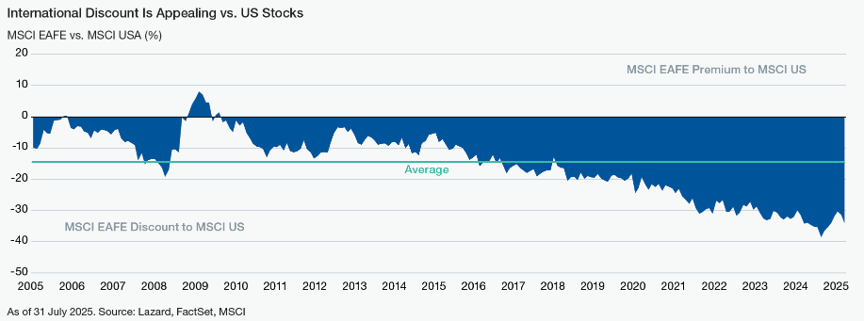
International markets took off as the dollar declined, reversing a multi-year strengthening trend. And much like the early 2000’s, U.S. equity valuations started the year at stretched levels with forward P/Es in their 90th percentile, while international markets offered significant discounts. Trade policy uncertainty surrounding tariff implementation raised questions about U.S. growth prospects and the divergence in global monetary policy also hindered U.S. market performance. The U.S. was late to the accommodative policy game. Though the Fed has now entered an easing cycle, this did not start until September 2025, lagging international central banks who were further into easing regimes, and whose markets have benefited from the favorable conditions this created for non- U.S. assets.

With this backdrop of alternating leadership cycles, the question for investors in 2025 is whether today’s environment marks a new phase or simply another rotation within the broader U.S. dominance trend. Looking at these eras of comparative performance highlights some patterns. First, currency movements display strong correlation to equity performance with Dollar strength and U.S. equity outperformance exhibiting high positive correlation. When the dollar strengthens, international returns suffer from unfavorable currency translation for U.S. investors, U.S. companies with foreign revenue see earnings compressed, emerging markets face debt servicing pressures and capital outflow, and commodities (priced in dollars) typically weaken. Conversely, dollar weakness creates powerful tailwinds for international outperformance. Given the strong historical relationship between dollar movements and relative equity returns, currency positioning matters significantly. With the dollar down approximately 10% from recent peaks in 2025, history suggests significant room for further weakness.
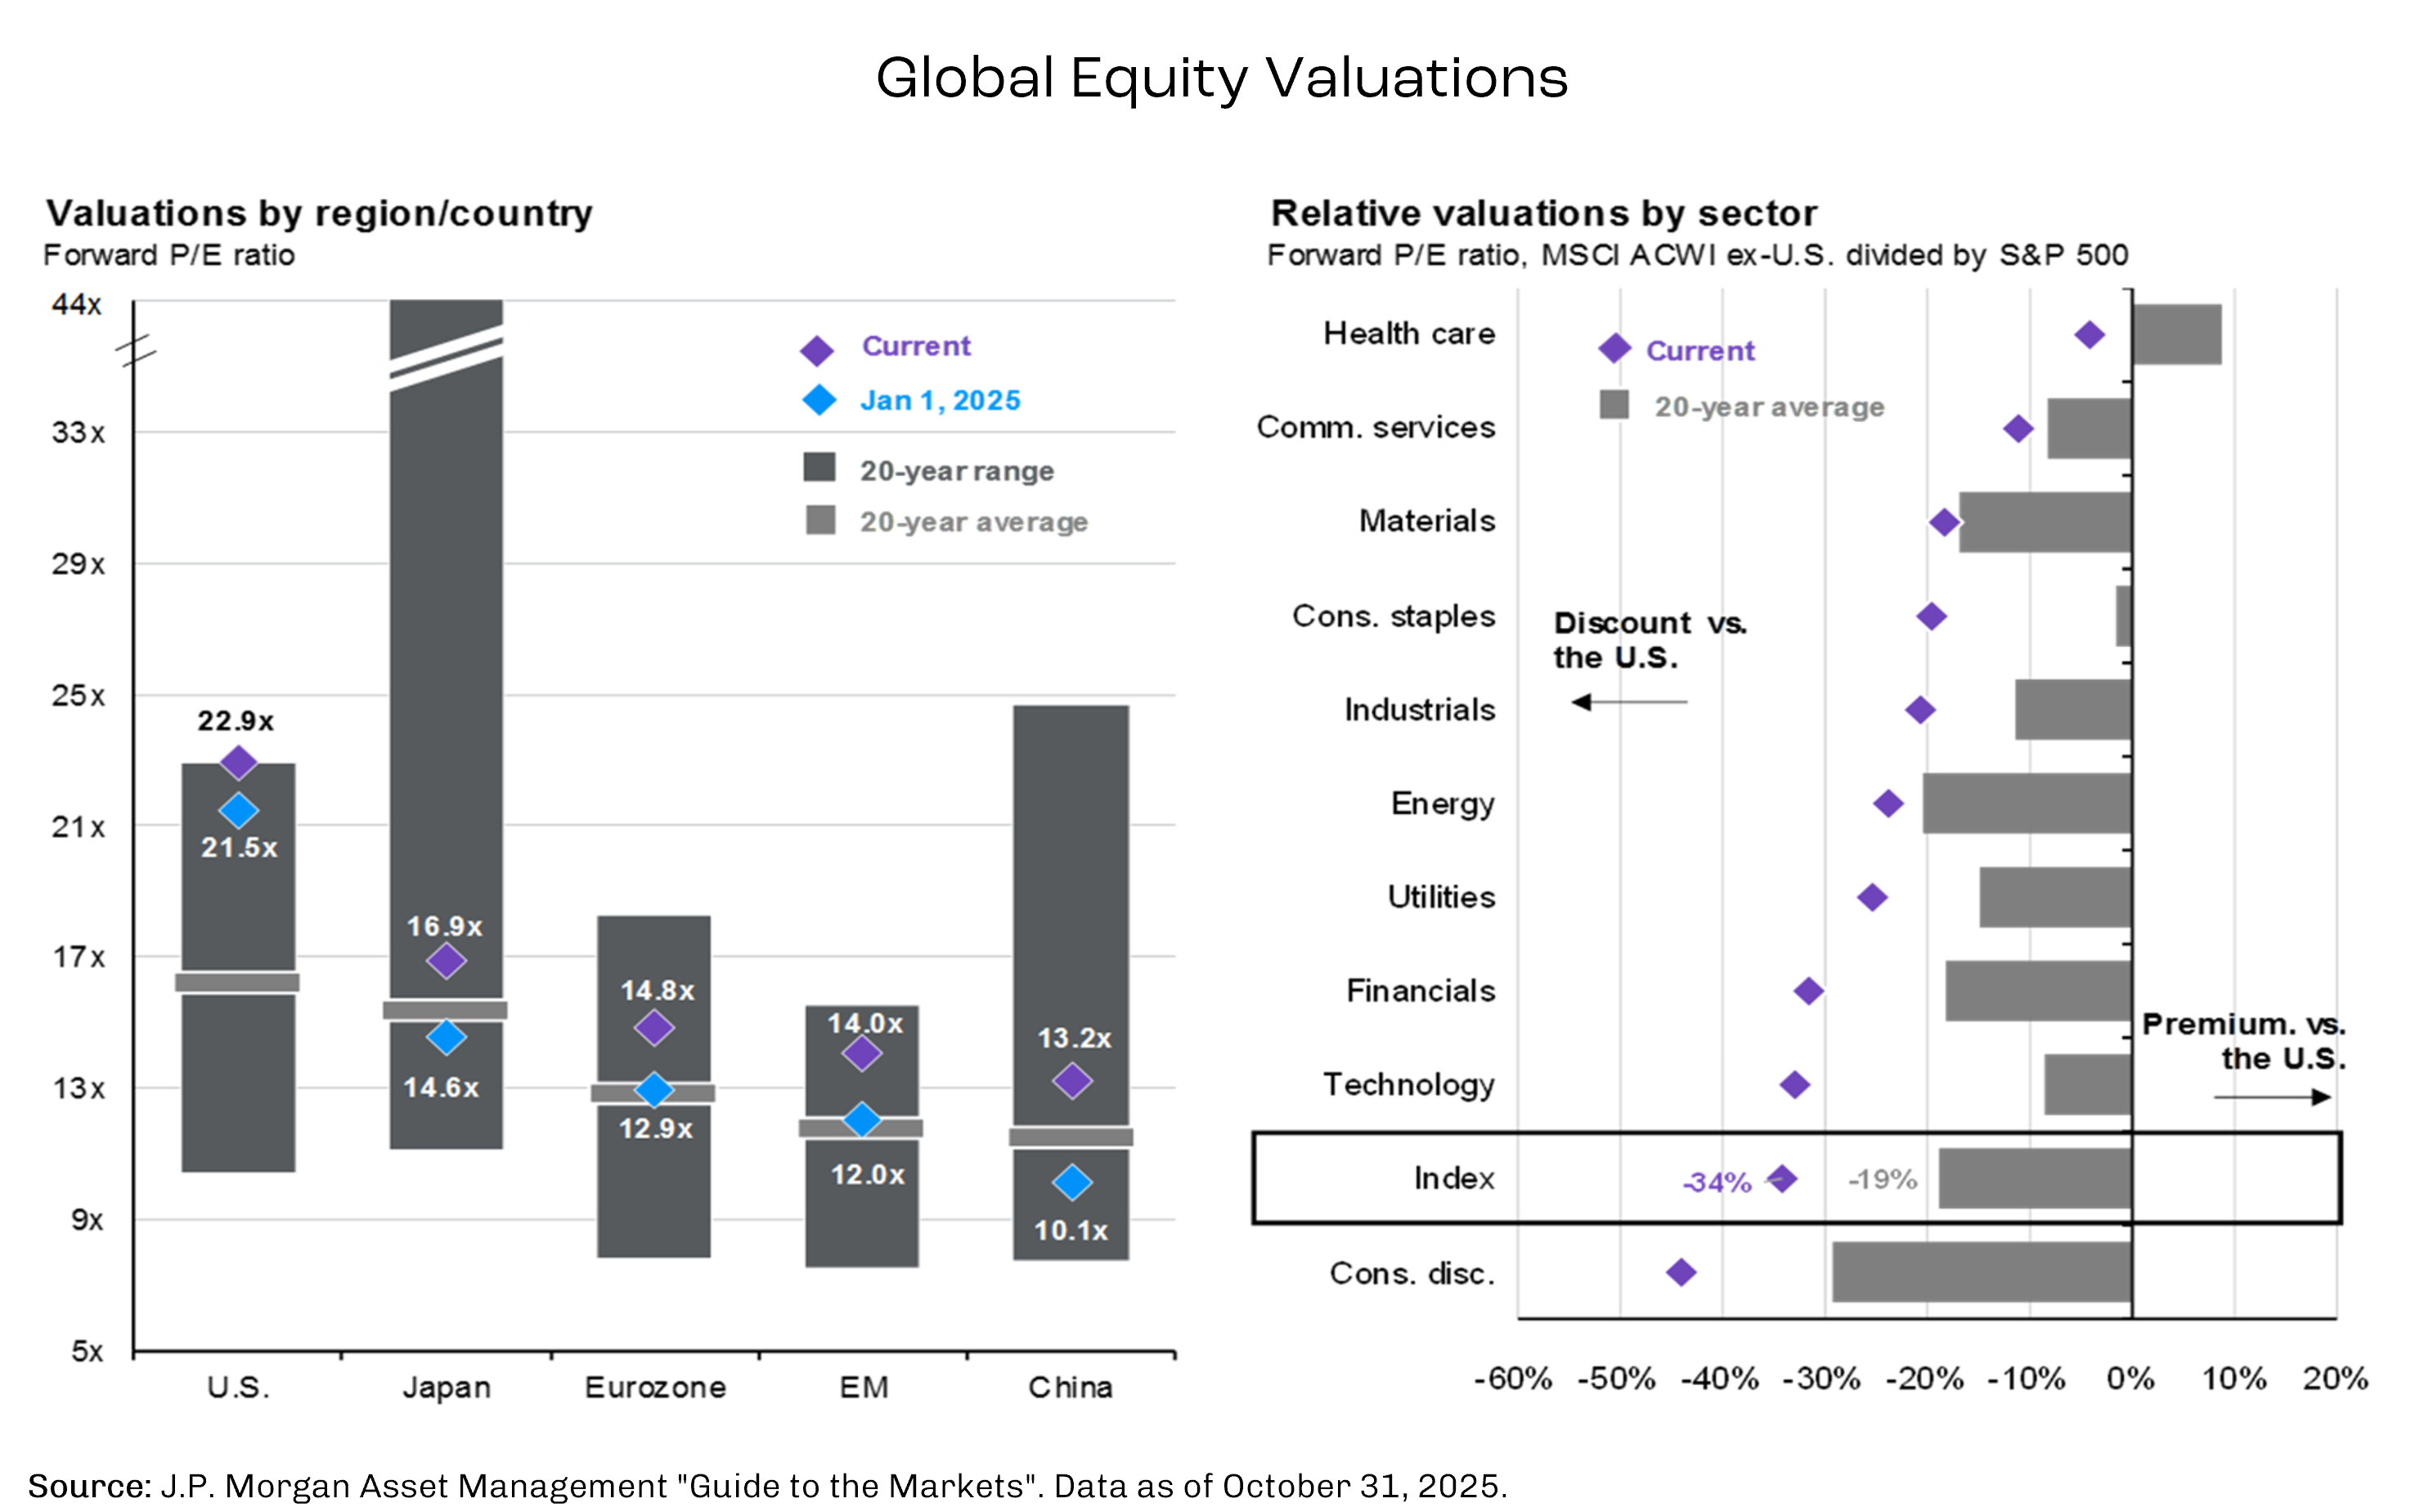
Second, valuation discipline has consistently mattered throughout market history. Periods of excessive valuation expansion have tended to create mathematical headwinds for future returns, and extreme valuation disparities between regions have rarely persisted over multi-year periods. Today, the U.S. trades near the 90th–100th percentile of historical valuation ranges, a level that would require either extraordinary earnings growth or acceptance of lower forward returns to sustain. The current valuation gap between U.S. and international equities is among the widest on record. Historically, when U.S. markets have traded at such premium levels, subsequent international returns have often been higher. While the U.S. growth story remains compelling, current valuations already reflect optimistic assumptions, potentially leaving less room for upside relative to international markets trading at more moderate multiples.
And while valuation changes dominate shorter periods, earnings growth is the primary driver of equity returns over full cycles. For example, EAFE outperformed in 2000 – 2008 because companies in these regions outearned U.S. companies. Likewise, the 2010 – 2024 U.S. outperformance reflected superior U.S. earnings growth, though magnified by valuation expansion. For international markets to sustain outperformance beyond current valuation reversion, they will need to demonstrate earnings growth acceleration.
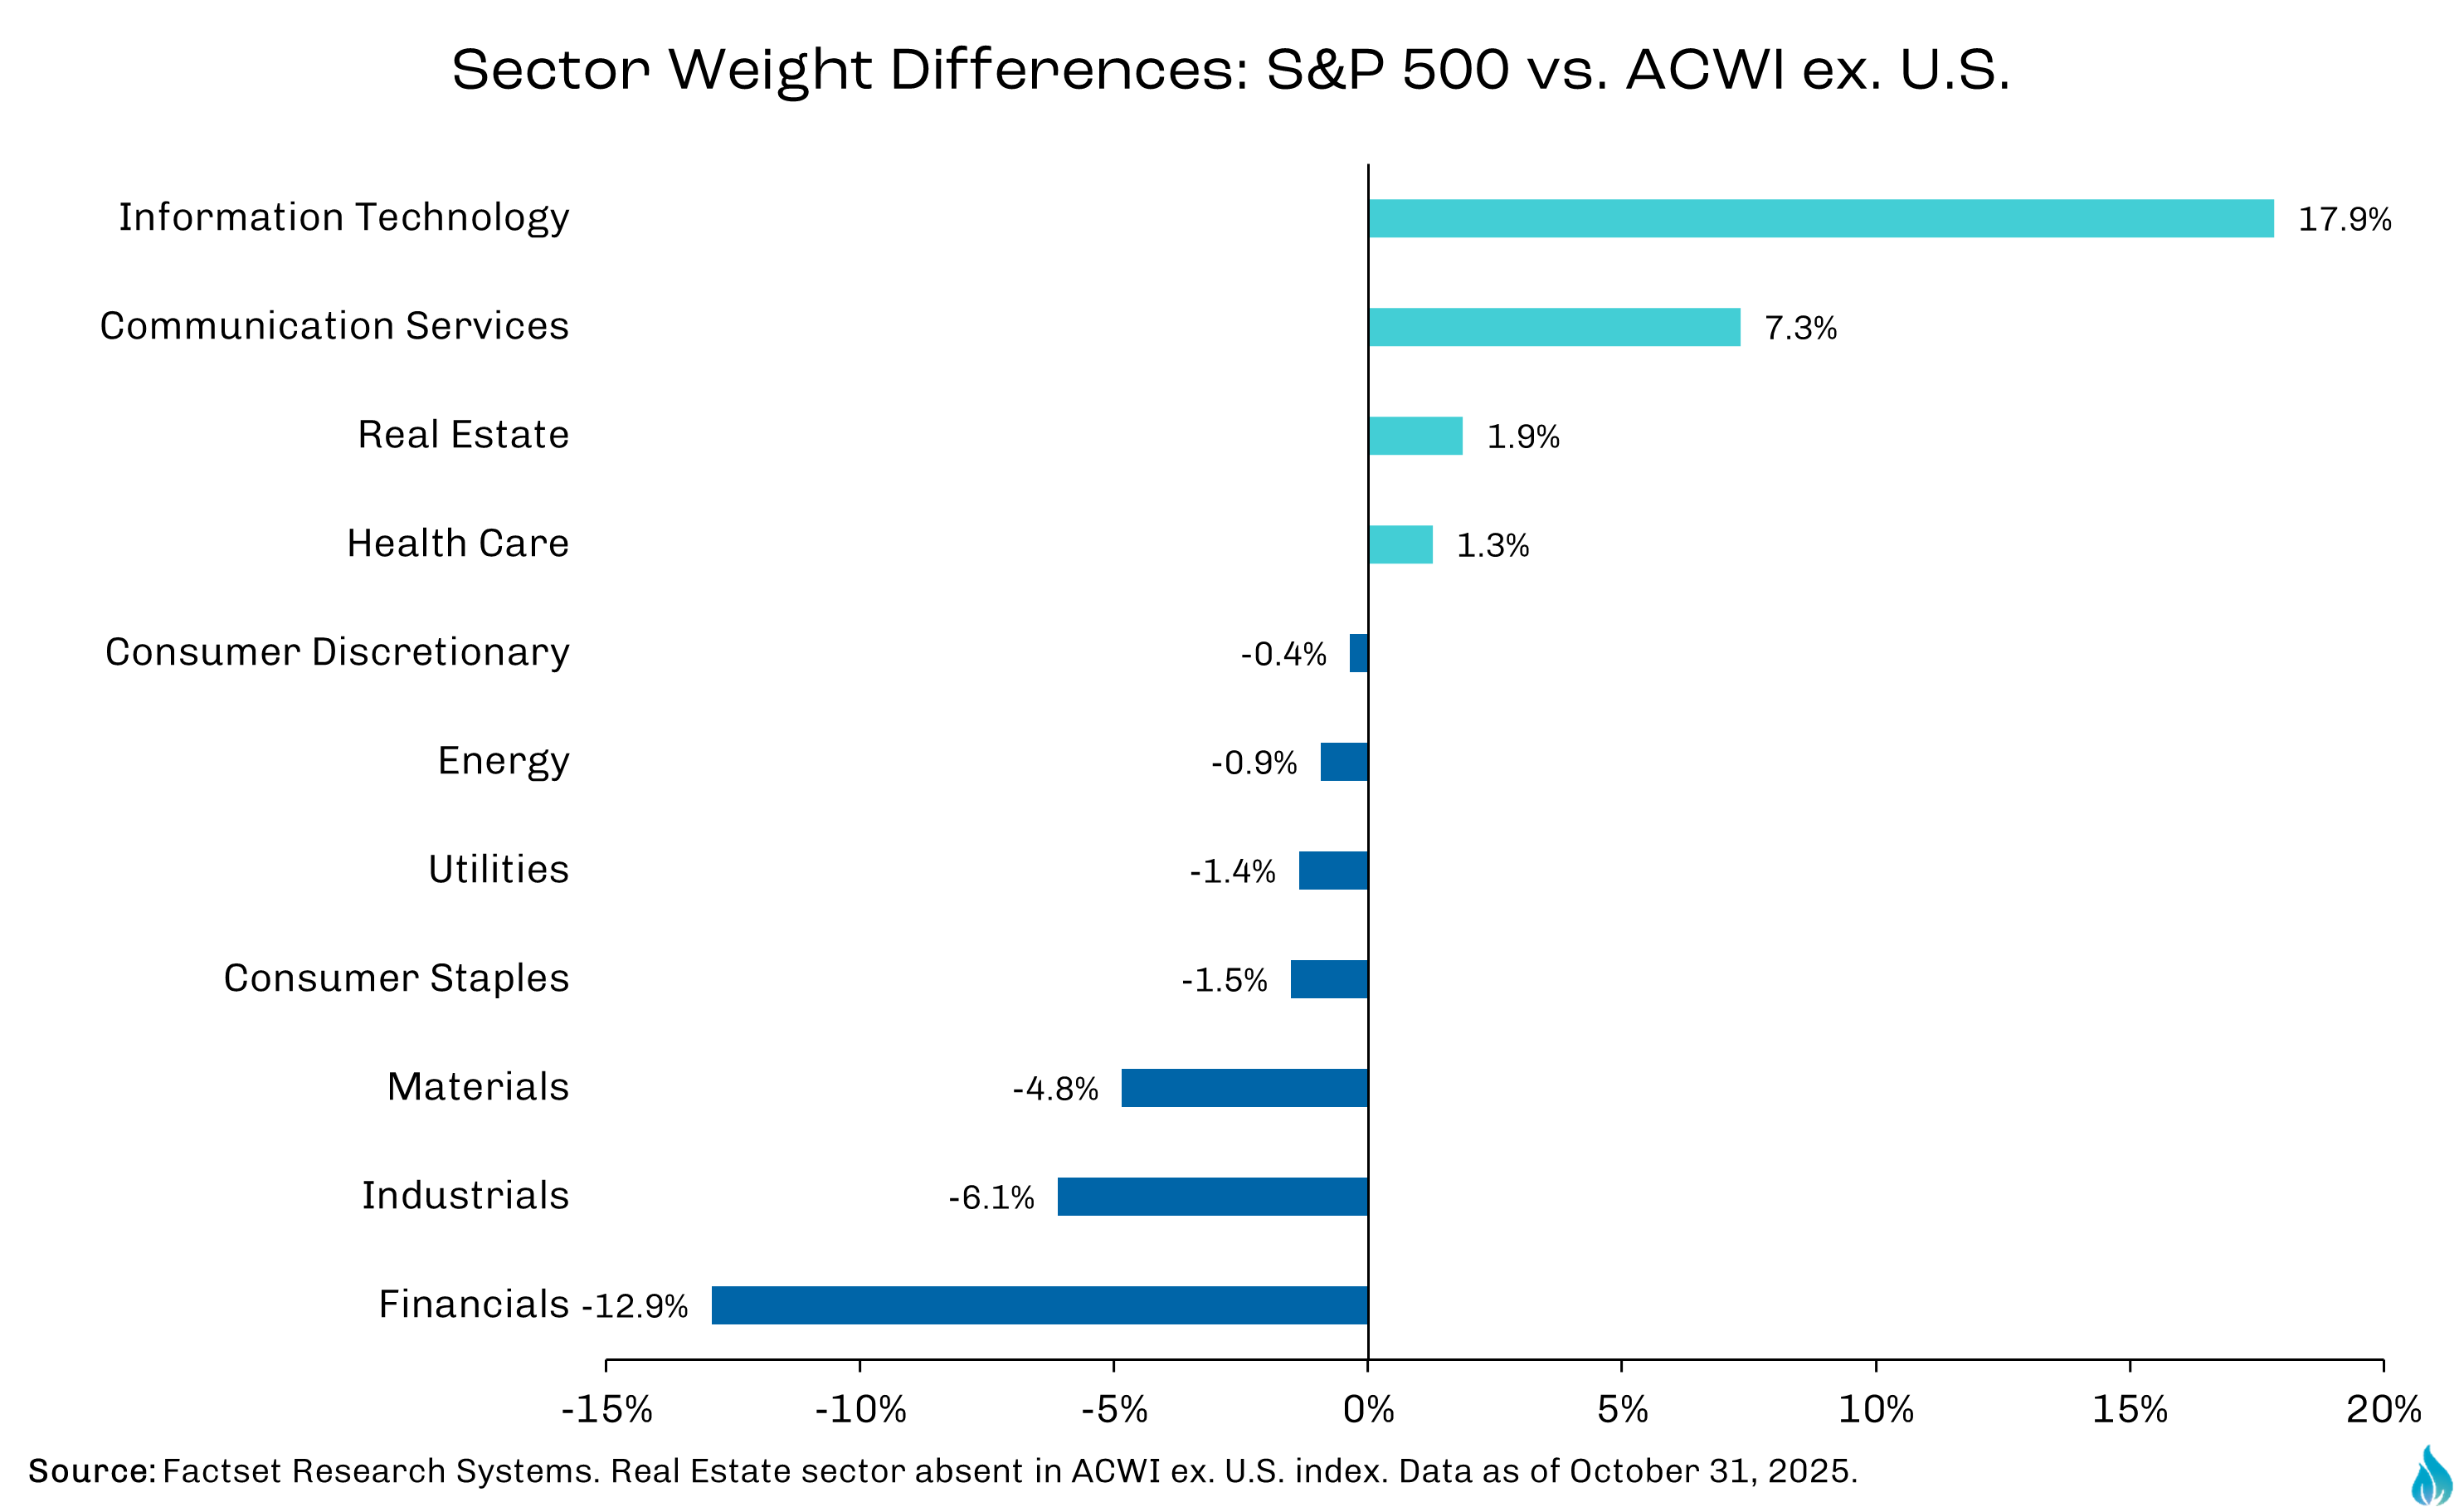
Finally, it should be noted that sector composition and concentration of indices can impact market performance differentials. Approximately half of U.S. outperformance over the last ~15 years can be explained by sector differences, particularly the large U.S. technology weighting. Different economic environments have varied impacts on sectors. For example, high growth, low-rate environments favor growth/technology. This benefits the U.S. with a large relative tech exposure. Cyclical expansions favor industrials, materials, energy, which typically benefit international markets with higher commodity exposure, and reflationary environments favor value sectors, which are also more prominent internationally. Beyond this, the narrow technology-driven U.S. rally of recent years also signals some concentration risk. When leadership broadens, like what occurred in Q3 2025, international markets often benefit from more diversified sector exposures.
In the last 15 years, we have experienced 12 distinct Taylor Swift eras, yet only one dominant U.S. outperformance cycle. Analysis shows that no cycle lasts forever. For example, Japan appeared unstoppable in the 1980s before its markets entered multiple decades of underperformance. Likewise, U.S. technology dominance in the 1990’s seemed permanent before the dot-com bubble led to a lost-decade for U.S. equity markets. And history also shows that the longer a cycle extends, particularly when driven by valuation expansion rather than earnings, the more powerful the eventual mean reversion tends to be.
Focusing on the present, it appears financial markets are considering following Taylor Swift’s lead by moving into a “broadening era,” as several factors suggest the rotation into international outperformance may prove more durable than transient. Even after international market 2025 gains, the valuation gap between domestic and international markets remains extreme. This could provide a multi-year runway for mean reversion. And if U.S. valuation expansion has reached its limits, this will also temper future domestic market returns. Meanwhile, international earnings growth is accelerating, helping boost the outlook for future returns. On top of this, the dollar may be in a decline phase, and fiscal and monetary policy is becoming relatively more supporting (e.g., Europe and China stimulus).
But there are arguments to be made for the continued strength of U.S. markets. For example, some posit that the U.S. technology moat will remain due to network effects and data advantages. Additionally, U.S. demographic trends are relatively more favorable than most developed markets. Finally, the U.S. has deep and liquid capital markets with strong investor protections that continue to attract global capital.
Looking abroad, China’s slowdown may be more structural than cyclical, Europe is facing persistent challenges, and emerging markets are vulnerable to trade wars and tariff uncertainty.
So, what does the historical analysis tell us about positioning portfolios? Overall, the 2025 rotation may represent the early stages of a multi-year reversal, consistent with historical patterns and indicative of a sign to recalibrate global balance with a gradual reallocation toward international exposure. But we also know that past performance does not guarantee future results. Although signals suggest international may continue to outperform, timing inflection points is notoriously difficult, and paths are rarely linear. Japanese investors in 1989, American investors in 2000, and international investors in 2010 all suffered from overconcentration at cycle peaks. Prudent portfolios maintain exposure to both U.S. and international markets, never abandoning diversification entirely.
Emerging markets have delivered some of the strongest returns in 2025. Within emerging markets, performance has been broad, however there has been significant regional variations. This year, China’s up, driven early in the year by DeepSeek AI innovation and more recently by stimulus measures and shifting sentiment. India continues to experience strong domestic growth momentum; however performance YTD has been tempered due to high valuations. Finally, Brazil and Mexico are both up for the year, with commodity strength and reduce tariff fears helping bolster returns, while Korea and Taiwan markets are benefiting from semiconductor demand.

As with developed markets, emerging markets started the year at a steep valuation discount to U.S. and despite the strong 2025 returns, valuations remain relatively attractive. Additionally, periods of dollar weakness have been historically bullish for emerging market assets. Along with valuation and currency advantages, there is also fundamental strength in emerging markets. Earnings are expected to accelerate with earnings growth of 17% in 2025 vs 10% in 2024. Moreover, the average EM sovereign rating reached BBB-, representing improved credit quality and marking the highest average rating to date.
Looking forward, consensus forecasts call for continued outperformance across emerging markets broadly, though likely with more modest gains than we have experienced this year. Both GDP growth and earnings growth are expected to remain robust, and continued dollar weakness or even stabilization would be expected to help returns. As with much of the world, policy accommodations continue to be favorable with rate-cutting cycles looking like they have more room to continue. Of course, we will continue to watch risks in the region, including tariff escalation (particularly trade tensions between U.S. and China) or a reversal in dollar weakness. Moreover, many EM economies remain commodity-dependent, so commodity price reversals or increased volatility would be a headwind.
The international outperformance was not restricted to emerging markets. After years of underperformance, developed international markets have also staged a comeback. Heightened geopolitical tensions have driven massive increases in local defense spending, benefiting European defense contractors. Germany also made a significant shift toward fiscal expansion, including a 500-billion-euro infrastructure fund, while the European Central Bank (ECB) has maintained accommodative policy with falling inflation, supporting European equity valuations. This year, European Financials have shown incredible strength with banks enjoying solid performance supported by improving net interest margins and credit quality.

That is not to say there are no challenges. Europe faces its own currency headwinds as the euro has strengthened approximately 14% vs. dollar YTD. Further strengthening of the euro relative to the dollar could put pressure on earnings from dollar-denominated revenue. Moreover, earnings estimate revisions have trended lower, with 2025 consensus expectations falling from +8% to -1%. These earnings growth expectations may still be too optimistic given currency headwinds. And while growth expectations have increased for the region, European industrials face exposure to the Chinese economic slowdown and exporters are exposed to potential tariff escalations as geopolitical uncertainty remains elevated.
One standout in developed markets is Japan. Japanese equities have delivered strong returns in 2025, reaching new all-time highs above 52,000. A primary driver of this is the corporate governance revolution in Japan. The country is experiencing ongoing financial market reforms that prioritize shareholder returns and value creation for investors. On the policy front, while other countries are easing rates, the BOJ has made gradual rate increases following years of deflationary environments, signaling it may be finally escaping its deflationary trap and entering a period of inflation normalization. Finally, as with the U.S., Japan’s technology sector strength has been a boost as it’s AI-related stocks have benefited from the global tech momentum. Many of these market drivers are structural factors which could provide continued support for a multi-year transformation.
For example, the Tokyo Stock Exchange requirements for capital efficiency continue to drive shareholder-focused management, and Japanese companies are conducting record share buy-back programs. As they continue to break out of the deflationary mindset, we see evidence of wage growth with real wage gains helping boost economic activity. Meanwhile, policy coordination between fiscal, monetary, and corporate governance is providing solid support for local financial markets. Finally, Japan’s markets, with a large tech concentration, should continue to appreciate so long as the AI hype continues. Their companies play important roles in producing semiconductor materials, as well as advancements in robotics and automation.
As we have discussed, the path forward is rarely linear. Moving into 2026, we will likely observe continued rotation, volatility, and dispersion across geographies. However, by maintaining a globally diversified approach, portfolios are well-positioned to capture opportunities while managing risks as we navigate what may well prove to be a genuine shifting of the guard in global equity markets.
We’ve outlined many of the supporting signs suggesting that rotation into international equities may be durable as opposed to transitory. Despite strong 2025 performance, international markets trade at meaningful discounts. These valuation gaps are even more pronounced for small-cap stocks, which should also benefit from reduced debt servicing costs from rate cuts as well as relatively less exposure to international trade tensions due to higher average domestic orientation levels. Looking at currency trends, even absent further dollar decline, dollar stability at current levels removes what had been a strong headwind from long periods of a strong dollar. Further, both emerging markets and Europe show signs of earnings acceleration and because U.S. investors have been, on average, under-allocated to international equity allocations, there is room for capital flows to drive higher.
Thematically, while the AI boom is certainly alive and well in the U.S., this is anything but a pure domestic play. 2025 saw meaningful technological innovation and adoption outside the U.S. with China, Korea, Taiwan, Japan and even Europe all playing important roles in the AI value chain. Though the U.S. and Taiwan maintain dominance in leading-edge chip design and manufacturing, the AI build includes important roles for Korea (memory), Japan (materials), and Europe (equipment). Rather than seeing AI enthusiasm fading, the theme is broadening geographically and moving from infrastructure to applications. To that end, we are evaluating sectors that stand to benefit most from efficiency gains tied to AI adoption. Notable areas of interest include healthcare and biotech opportunities as well as advancements in financial services industry. Though not a play on specific regions or international vs. domestic, leaning heavier into AI trends may naturally lead to a more globally diverse portfolio.
The global equity market landscape has exhibited a marked shift in 2025, with international equities in both developed and emerging markets delivering strong double-digit returns, driven by valuation reversion, dollar weakness, improving fundamentals, and policy support. This rotation away from U.S.-dominant positioning toward more balanced international outperformance has prompted significant debate within the investment community about whether we are at a structural inflection point or simply experiencing another cyclical interlude.
The question facing investors might be captured in two contrasting scenarios: in one, U.S. markets experience temporary underperformance before recovering, embodied in the sentiment that "we never go out of style." In another scenario, more fundamental shifts suggest a longer lasting change of market leadership. The historical evidence presented here indicates that both outcomes have precedent; the key question is which forces will prove dominant.
The case for a shift in positioning appears increasingly compelling. While the U.S. market retains many enduring strengths, concentration risks, elevated valuations, and policy uncertainties suggest a more balanced global approach is warranted for 2026. The themes driving this year's rotation appear increasingly sticky: the valuation gap, while narrower than at the start of 2025, remains meaningful; the dollar's structural challenges persist; emerging market fundamentals continue strengthening in real time; and the AI theme continues to expand its reach beyond domestic borders.
Prudent portfolios should maintain global diversification, quality, and selectivity across regions and sectors, adjusting weight based on fundamentals and outlook, but never abandoning geographic balance entirely. The historical pattern is clear: market leadership cycles are real, they are long-lasting, and they are often surprising in their magnitude when they reverse.

.png)
